V2X, Inc.
| Security | VVX / V2X, Inc. |
| Insider | Jeremy C Wensinger |
This page shows the track record and history of WENSINGER JEREMY C
insider trades in V2X, Inc.. The SEC defines Insiders as officers, directors, or significant investors (greater than 10% ownership) in a company.
It is illegal for insiders to make trades in their companies based on material, non-public information ("MNPI"). This does not mean
it is illegal for them to make any
trades in their own companies. However, they must report all trades to the SEC via a Form 4.
Insider Purchases - Short Term Profit Analysis
In this section, we analyze the profitability of every unplanned, open-market insider purchase made by Jeremy C Wensinger in VVX / V2X, Inc.. This analysis helps to understand if the insider consistently generates abnormal returns, and is worth following. This analysis is for one-year following each trade, and the results are theoretical.
The following table shows the most recent open market purchases that were not part of an automatic trading plan.
| Trade Date | Reported Shares |
Reported Price |
Adjusted Shares |
Adjusted Price |
Cost Basis | Days to Max |
Price at Max |
Max Profit ($) |
Max Return (%) |
|---|---|---|---|---|---|---|---|---|---|
| 2024-09-06 | 6,250 | 48.0000 | 6,250 | 48.0000 | 300,000 | 61 | 68.8200 | 130,125 | 43.38 |
Adjusted Price is the split-adjusted price. Adjusted Shares is the split-adjusted shares.
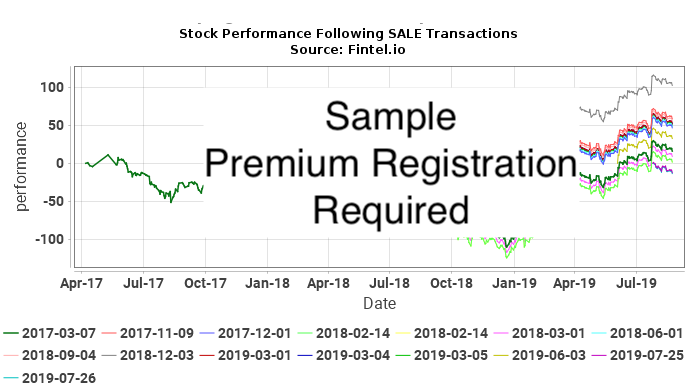
Insider Sales - Short Term Loss Analysis
In this section, we analyze the short-term loss avoidance of every unplanned, open-market insider sale made by Jeremy C Wensinger in VVX / V2X, Inc.. A consistent pattern of loss avoidance may suggest that future sale transactions may predict declines in price. This analysis is for one-year following each trade, and the results are theoretical.
The following table shows the most recent open market purchases that were not part of an automatic trading plan.
| Trade Date | Reported Shares |
Reported Price |
Adjusted Shares |
Adjusted Price |
Cost Basis | Days to Min |
Price at Min |
Max Loss Avoided ($) |
Max Loss Avoided (%) |
|---|---|---|---|---|---|---|---|
| There are no known unplanned open-market trades for this insider |
Adjusted Price is the split-adjusted price. Adjusted Shares is the split-adjusted shares.
Insider Transaction History
| File Date |
Trade Date |
Form | Insider | Ticker | Security Title | Code | Direct | Exercise Price |
Unit Price |
Units Changed |
Value Changed (1K) |
Remaining Options |
Remaining Shares |
|
|---|---|---|---|---|---|---|---|---|---|---|---|---|---|---|
| 2026-03-13 | 2026-03-12 | 4 | WENSINGER JEREMY C | VVX | V2X, Inc. Common Stock | D | 69.9150 | -4,743 | -332 | 24,323 | ||||
| 2026-03-13 | 2026-03-12 | 4 | WENSINGER JEREMY C | VVX | V2X, Inc. Common Stock | D | 10,516 | 29,066 | ||||||
| 2026-02-27 | 2026-02-25 | 4 | WENSINGER JEREMY C | VVX | V2X, Inc. Common Stock | D | 68.5650 | -1,806 | -124 | 18,550 | ||||
| 2026-02-27 | 2026-02-25 | 4 | WENSINGER JEREMY C | VVX | V2X, Inc. Common Stock | D | 6,000 | 20,356 | ||||||
| 2025-06-26 | 2025-06-25 | 4 | WENSINGER JEREMY C | VVX | V2X, Inc. Common Stock | D | 46.6300 | -6,660 | -311 | 14,356 | ||||
| 2025-06-26 | 2025-06-25 | 4 | WENSINGER JEREMY C | VVX | V2X, Inc. Common Stock | D | 14,766 | 21,016 | ||||||
| 2024-09-09 | 2024-09-06 | 4 | WENSINGER JEREMY C | VVX | V2X, Inc. Common Stock | D | 48.0000 | 6,250 | 300 | 6,250 |
P
공개 시장에서 또는 사적으로 비파생증권 또는 파생증권 매입
S
공개 시장에서 또는 사적으로 비파생증권 또는 파생증권 매각
A
자사로부터 유가증권(옵션 등)을 보조, 지급 또는 기타 취득
C
파생상품 전환
D
자사에게 유가증권을 매각 또는 양도
F
기업으로부터 인도 받은 유가증권의 일부를 사용한 행사 가격 또는 조세 채무의 지급
G
내부자에 의한 또는 내부자에게 증권 증여
K
지분스왑 및 유사 위험 회피거래
M
자사로부터 인도 받은 파생증권(옵션 등)의 행사 또는 전환
V
보고서 양식 4에 자진 신고된 거래
J
기타 (거래 내용을 설명하는 각주와 동반)