미국 오일-드라이 코퍼레이션(Oil-Dri Corporation of America)
| Security | ODC / Oil-Dri Corporation of America |
| Insider | Allan H Selig |
This page shows the track record and history of SELIG ALLAN H
insider trades in Oil-Dri Corporation of America. The SEC defines Insiders as officers, directors, or significant investors (greater than 10% ownership) in a company.
It is illegal for insiders to make trades in their companies based on material, non-public information ("MNPI"). This does not mean
it is illegal for them to make any
trades in their own companies. However, they must report all trades to the SEC via a Form 4.
Insider Purchases - Short Term Profit Analysis
In this section, we analyze the profitability of every unplanned, open-market insider purchase made by Allan H Selig in ODC / Oil-Dri Corporation of America. This analysis helps to understand if the insider consistently generates abnormal returns, and is worth following. This analysis is for one-year following each trade, and the results are theoretical.
The following table shows the most recent open market purchases that were not part of an automatic trading plan.
Adjusted Price is the split-adjusted price. Adjusted Shares is the split-adjusted shares.
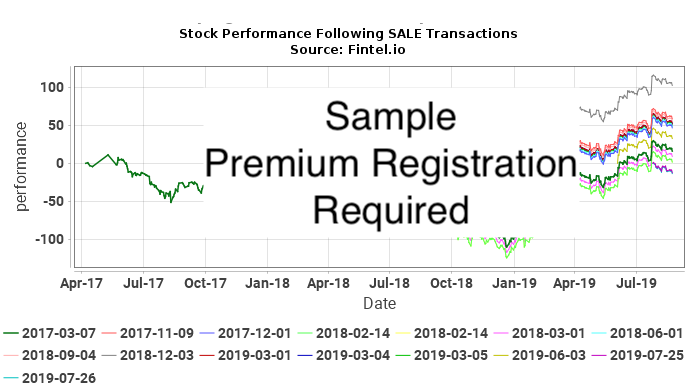
Insider Sales - Short Term Loss Analysis
In this section, we analyze the short-term loss avoidance of every unplanned, open-market insider sale made by Allan H Selig in ODC / Oil-Dri Corporation of America. A consistent pattern of loss avoidance may suggest that future sale transactions may predict declines in price. This analysis is for one-year following each trade, and the results are theoretical.
The following table shows the most recent open market purchases that were not part of an automatic trading plan.
| Trade Date | Reported Shares |
Reported Price |
Adjusted Shares |
Adjusted Price |
Cost Basis | Days to Min |
Price at Min |
Max Loss Avoided ($) |
Max Loss Avoided (%) |
|---|---|---|---|---|---|---|---|
| There are no known unplanned open-market trades for this insider |
Adjusted Price is the split-adjusted price. Adjusted Shares is the split-adjusted shares.
Insider Transaction History
| File Date |
Trade Date |
Form | Insider | Ticker | Security Title | Code | Direct | Exercise Price |
Unit Price |
Units Changed |
Value Changed (1K) |
Remaining Options |
Remaining Shares |
|
|---|---|---|---|---|---|---|---|---|---|---|---|---|---|---|
| 2025-12-15 | 2025-12-15 | 4 | SELIG ALLAN H | ODC | Common Stock | D | 51.6800 | 1,000 | 52 | 103,000 | ||||
| 2023-12-18 | 2023-12-15 | 4 | SELIG ALLAN H | ODC | Common Stock | D | 68.8900 | 1,000 | 69 | 51,000 | ||||
| 2023-06-16 | 2023-06-15 | 4 | SELIG ALLAN H | ODC | Common Stock | D | 50.5500 | 1,000 | 51 | 50,000 | ||||
| 2021-10-21 | 2021-10-20 | 4 | SELIG ALLAN H | ODC | Common Stock | D | 34.9100 | 1,000 | 35 | 49,000 | ||||
| 2021-09-13 | 2021-09-10 | 4 | SELIG ALLAN H | ODC | Common Stock | D | 34.4800 | 2,000 | 69 | 48,000 | ||||
| 2021-04-23 | 2021-04-21 | 4 | SELIG ALLAN H | ODC | Common Stock | D | 35.1600 | 1,000 | 35 | 46,000 | ||||
| 2021-01-21 | 2021-01-20 | 4 | SELIG ALLAN H | ODC | Common Stock | D | 33.7300 | 1,000 | 34 | 45,000 | ||||
| 2020-12-09 | 2020-12-08 | 4 | SELIG ALLAN H | ODC | Common Stock | D | 35.5000 | 2,000 | 71 | 44,000 | ||||
| 2020-10-19 | 2020-10-15 | 4 | SELIG ALLAN H | ODC | Common Stock | D | 37.1500 | 473 | 18 | 42,000 | ||||
| 2020-10-19 | 2020-10-15 | 4 | SELIG ALLAN H | ODC | Common Stock | D | 36.4600 | 366 | 13 | 41,527 | ||||
| 2020-10-19 | 2020-10-15 | 4 | SELIG ALLAN H | ODC | Common Stock | D | 35.4700 | 161 | 6 | 41,161 | ||||
| 2020-06-12 | 2020-06-11 | 4 | SELIG ALLAN H | ODC | Common Stock | D | 34.8800 | 303 | 11 | 41,000 | ||||
| 2020-06-12 | 2020-06-11 | 4 | SELIG ALLAN H | ODC | Common Stock | D | 33.7500 | 697 | 24 | 40,697 | ||||
| 2020-04-15 | 2020-04-14 | 4 | SELIG ALLAN H | ODC | Common Stock | D | 33.4100 | 1,000 | 33 | 40,000 | ||||
| 2019-10-21 | 2019-10-17 | 4 | SELIG ALLAN H | ODC | Common Stock | D | 33.8200 | 1,000 | 34 | 39,000 | ||||
| 2018-12-18 | 2018-12-17 | 4 | SELIG ALLAN H | ODC | Common Stock | D | 25.9000 | 1,000 | 26 | 38,000 | ||||
| 2018-11-06 | 2018-11-02 | 4 | SELIG ALLAN H | ODC | Common Stock | D | 30.9400 | 2,000 | 62 | 37,000 | ||||
| 2018-10-17 | 2018-10-16 | 4 | SELIG ALLAN H | ODC | Common Stock | D | 30.5600 | 900 | 28 | 35,000 | ||||
| 2018-10-17 | 2018-10-16 | 4 | SELIG ALLAN H | ODC | Common Stock | D | 31.6300 | 100 | 3 | 34,100 | ||||
| 2018-06-13 | 2018-06-12 | 4 | SELIG ALLAN H | ODC | Common Stock | D | 42.0800 | 1,000 | 42 | 34,000 | ||||
| 2018-03-14 | 2018-03-14 | 4 | SELIG ALLAN H | ODC | Common Stock | D | 37.1000 | 1,000 | 37 | 33,000 | ||||
| 2017-10-17 | 2017-10-16 | 4 | SELIG ALLAN H | ODC | Common Stock | D | 42.1600 | 1,500 | 63 | 32,000 | ||||
| 2017-07-24 | 2017-07-21 | 4 | SELIG ALLAN H | ODC | Common Stock | D | 43.5100 | 1,000 | 44 | 30,500 | ||||
| 2017-06-14 | 2017-06-13 | 4 | SELIG ALLAN H | ODC | Common Stock | D | 40.3800 | 1,000 | 40 | 29,500 | ||||
| 2017-03-16 | 2017-03-15 | 4 | SELIG ALLAN H | ODC | Common Stock | D | 36.8900 | 2,000 | 74 | 28,500 | ||||
| 2016-12-13 | 2016-12-13 | 4 | SELIG ALLAN H | ODC | Common Stock | D | 39.2200 | 1,500 | 59 | 26,500 | ||||
| 2016-10-18 | 2016-10-14 | 4 | SELIG ALLAN H | ODC | Common Stock | D | 34.7800 | 1,000 | 35 | 25,000 | ||||
| 2016-06-28 | 2016-06-27 | 4 | SELIG ALLAN H | ODC | Common Stock | D | 34.5200 | 1,000 | 35 | 24,000 | ||||
| 2016-03-18 | 2016-03-18 | 4 | SELIG ALLAN H | ODC | Common Stock | D | 34.7500 | 1,000 | 35 | 23,000 | ||||
| 2015-07-07 | 2015-07-06 | 4 | SELIG ALLAN H | ODC | Common Stock | D | 30.1800 | 1,000 | 30 | 22,000 | ||||
| 2014-04-23 | 2014-04-23 | 4 | SELIG ALLAN H | ODC | Common Stock | D | 33.8900 | 1,000 | 34 | 21,000 | ||||
| 2014-01-28 | 2014-01-28 | 4 | SELIG ALLAN H | ODC | Common Stock | D | 35.0800 | 3,000 | 105 | 20,000 | ||||
| 2013-12-12 | 2013-12-11 | 4 | SELIG ALLAN H | ODC | Common Stock | D | 33.9700 | 2,000 | 68 | 17,000 | ||||
| 2013-10-18 | 2013-10-18 | 4 | SELIG ALLAN H | ODC | Common Stock | D | 34.0000 | 2,000 | 68 | 15,000 | ||||
| 2013-07-01 | 2013-07-01 | 4 | SELIG ALLAN H | ODC | Common Stock | D | 27.7000 | 1,000 | 28 | 13,000 | ||||
| 2013-04-10 | 2013-03-20 | 4 | SELIG ALLAN H | ODC | Common Stock | D | 27.1300 | 2,000 | 54 | 12,000 |
P
공개 시장에서 또는 사적으로 비파생증권 또는 파생증권 매입
S
공개 시장에서 또는 사적으로 비파생증권 또는 파생증권 매각
A
자사로부터 유가증권(옵션 등)을 보조, 지급 또는 기타 취득
C
파생상품 전환
D
자사에게 유가증권을 매각 또는 양도
F
기업으로부터 인도 받은 유가증권의 일부를 사용한 행사 가격 또는 조세 채무의 지급
G
내부자에 의한 또는 내부자에게 증권 증여
K
지분스왑 및 유사 위험 회피거래
M
자사로부터 인도 받은 파생증권(옵션 등)의 행사 또는 전환
V
보고서 양식 4에 자진 신고된 거래
J
기타 (거래 내용을 설명하는 각주와 동반)