주식회사 아넥슨
소개
이 페이지에서는 Blackstone Holdings II L.P.의 공개된 내부자의 매매 거래 내역을 종합적으로 분석합니다. 내부자들은 기업의 임원(내부 경영진), 이사 또는 주요 투자자입니다. 일반적으로 내부자가 중요한 비공개 정보를 기반으로 자신이 속한 기업을 거래하는 것은 불법으로 간주됩니다. 이것은 내부자가 자신의 기업 내에서 행하는 모든 거래가 불법이라는 것을 뜻은 아닙니다. 그러나 그들은 자신들의 모든 거래를 양식 4를 통해 SEC에 보고해야만 합니다. 이러한 제한에도 불구하고, 학계 연구에 따르면 내부자는, 일반적으로, 자신의 회사 주식에 대한 실적이 시장의 수익률을 능가하는 경향성을 보였습니다.
평균 거래 수익성
평균 거래 수익성은 내부자가 지난 3년 동안 매입한 모든 "공개 시장"(Open market)에서의 매입의 평균 수익률입니다. 이를 계산하기 위해 10b5-1 거래 계획의 일부로 표시된 모든 거래를 제외하고 내부자가 계획되지 않은 모든 오픈 마켓에서의 매입을 조사합니다. 그런 다음 3개월, 6개월, 12개월 동안 해당 거래의 평균 성과를 계산하여 각 거래에 대한 최종 성과 지표를 생성합니다. 마지막으로 내부자에 대한 성과 지표를 계산하기 위해 모든 성과 지표의 평균을 내립니다. 이 목록에는 지난 2년 동안 최소 3번 이상 거래한 내부자만 포함됩니다.
내부자의 매매 거래 수익성이 "해당 없음"인 경우, 내부자는 지난 3년 동안 공개 시장에서 매수한 적이 없거나, 거래가 너무 최근에 이루어져서 신뢰할 수 있는 성과 지표를 산출할 수 없는 경우에 해당합니다.
업데이트 주기: 일별
내부자 포지션이 보고된 기업
SEC 서류에 따르면 Blackstone Holdings II L.P. 기업이 다음 기업에 대한 보유 또는 거래를 보고했습니다:
차트 해석 방법
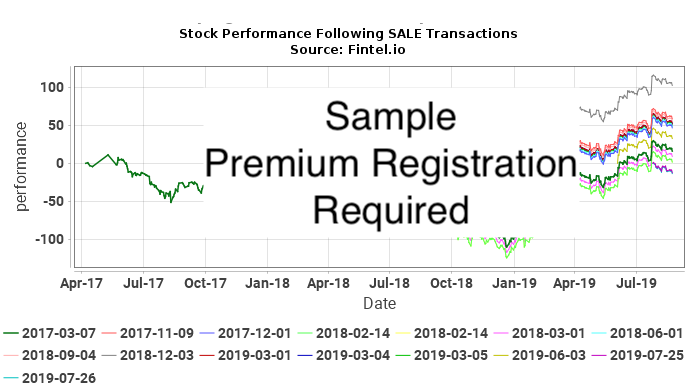
아래 차트는 Blackstone Holdings II L.P.에 의한 각 "공개 시장"(Open market)에서 계획되지 않은 거래 이후 증권의 주가 실적을 보여줍니다. 계획되지 않은 거래는 10b5-1 거래 계획의 일환으로 이루어지지 않은 거래입니다. 주가 실적은 주가의 누적 백분율 변화로 표시됩니다. 예를 들어, 2019년 1월 1일 내부자의 매매 거래가 이루어졌을 경우, 차트는 현재까지 증권의 일별 백분율 변화를 보여줍니다. 이 기간 동안 주가가 10달러에서 15달러로 간다면, 주가의 누적 백분율 변화는 50%가 됩니다. 10달러에서 20달러로의 가격 변화는 100%가 되며, 10달러에서 5달러로의 가격 변화는 -50%가 됩니다.
궁극적으로 내부자의 매매 거래가 내부자의 정보를 이용하여 이익을 얻기 위해 거래 타이밍을 맞추고 있는지 확인하기 위해 내부자의 매매 거래가 주가의 초과 수익률(양 또는 음)과 얼마나 밀접한 상관 관계가 있는지 확인하고자 합니다. 내부자가 이러한 작업을 수행하고 있는 상황을 고려해 보겠습니다. 이러한 상황에서 우리는 (a) 매입 후 양의 수익률 또는 (b) 매각 후 음의 수익률을 기대할 수 있습니다. (a)의 경우, 매입 차트는 상향으로 기울어진 일련의 곡선을 보여주며, 각 매입 거래 후 양의 수익률을 나타냅니다. (b)의 경우, SALE 차트는 하향으로 기울어진 일련의 곡선을 보여주며, 각 판매 거래 후 음의 수익률을 나타냅니다.
그러나 이것만으로는 결론을 도출하기에 충분하지 않습니다. 예를 들어, 해당 기업의 주가가 수년에 걸쳐 비주기적 상승 추세에 있다면, Fintel은 매입 후 도표가 모두 상향 곡선으로 예상할 수 있습니다. 마찬가지로, 수년에 걸쳐 비주기적 하락은 거래 후에 하향 곡선으로 초래할 가능성이 높습니다. 이 도표들 중 어느 것도 내부자의 매매 거래 활동을 시사하지는 않습니다.
가장 강력한 지표는 주가가 극단적으로 순환하는 상황일 것이고, PURCHASE 차트에는 긍정적인 시그널이, SALE 차트에는 부정적인 플롯이 존재했습니다. 이는 자신들의 금전적 이익을 위한 거래 타이밍을 재던 내부자에 의한 상황일 가능성이 높습니다.
내부자 매입 ANNX / Annexon, Inc.: 단기 이익 분석
이 섹션에서는 ANNX / Annexon, Inc.에 대한 "공개 시장"(Open market)에서 계획되지 않은 내부자의 매입이 발생한 모든 상품의 수익성을 분석합니다. 이 분석은 내부자가 지속적으로 비정상적인 수익을 창출하는지 이해하는 데 도움이 되며, 이를 따를 가치가 있습니다. 이 분석은 각 거래 후 1년 동안 수행되며, 결과는 이론 값입니다.
아래 표는 사전 거래 계획(Automated trading plan)에 포함되지 않은 가장 최근의 공개 시장 매입을 보여줍니다.
| 거래일 | 티커 | 내부자 | 보고된 지분 |
보고된 가격 |
조정된 지분 |
조정된 가격 |
가격 기준 | 최고까지 일수 |
최고 가격 |
최고 이익 ($) |
최고 수익률 (%) |
|---|---|---|---|---|---|---|---|---|---|---|---|
| 2020-07-28 | ANNX | Clarus Lifesciences III, L.P. | 200,000 | 17.0000 | 200,000 | 17.0000 | 3,400,000 | 231 | 35.01 | 3,602,000 | 105.94 |
조정 가격은 분할 조정된 가격입니다. 조정된 주식은 조정된 지분입니다.
내부자 매매 ANNX / Annexon, Inc.: 단기 손실 분석
이 섹션에서는 ANNX / Annexon, Inc.에서 이루어진 계획되지 않은 모든 공개 시장에서의 내부자 매도의 단기 손실 회피를 분석합니다. 일관된 손실 회피 패턴은 향후 매각 거래에서 가격 하락이 발생할 수도 있다는 것을 예측할 수 있습니다. 이 분석은 각 거래 후 1년을 대상으로 한 것이며, 결과는 이론 값입니다.
아래 표는 자동 거래 계획에 포함되지 않은 가장 최근의 "공개 시장"(Open market) 매매를 보여줍니다.
| 거래일 | 티커 | 내부자 | 보고된 지분 |
보고된 가격 |
조정된 지분 |
조정된 가격 |
가격 기준 | 최저까지 일수 |
최저에서 가격 |
회피된 최대 손실($) |
회피된 최대 손실율(%) |
|---|---|---|---|---|---|---|---|
| 이 내부자와 유가 증권의 조합과 관련하여 계획되지 않은 공개된 "공개 시장"(Open market) 거래는 없습니다. |
조정 가격은 분할 조정된 가격입니다. 조정된 주식은 조정된 지분입니다.
내부자 매입 APG / APi Group Corporation: 단기 이익 분석
이 섹션에서는 ANNX / Annexon, Inc.에 대한 "공개 시장"(Open market)에서 계획되지 않은 내부자의 매입이 발생한 모든 상품의 수익성을 분석합니다. 이 분석은 내부자가 지속적으로 비정상적인 수익을 창출하는지 이해하는 데 도움이 되며, 이를 따를 가치가 있습니다. 이 분석은 각 거래 후 1년 동안 수행되며, 결과는 이론 값입니다.
아래 표는 사전 거래 계획(Automated trading plan)에 포함되지 않은 가장 최근의 공개 시장 매입을 보여줍니다.
| 거래일 | 티커 | 내부자 | 보고된 지분 |
보고된 가격 |
조정된 지분 |
조정된 가격 |
가격 기준 | 최고까지 일수 |
최고 가격 |
최고 이익 ($) |
최고 수익률 (%) |
|---|---|---|---|---|---|---|---|
| 이 내부자와 유가 증권의 조합과 관련하여 계획되지 않은 공개된 "공개 시장"(Open market) 거래는 없습니다. |
조정 가격은 분할 조정된 가격입니다. 조정된 주식은 조정된 지분입니다.
내부자 매매 APG / APi Group Corporation: 단기 손실 분석
이 섹션에서는 ANNX / Annexon, Inc.에서 이루어진 계획되지 않은 모든 공개 시장에서의 내부자 매도의 단기 손실 회피를 분석합니다. 일관된 손실 회피 패턴은 향후 매각 거래에서 가격 하락이 발생할 수도 있다는 것을 예측할 수 있습니다. 이 분석은 각 거래 후 1년을 대상으로 한 것이며, 결과는 이론 값입니다.
아래 표는 자동 거래 계획에 포함되지 않은 가장 최근의 "공개 시장"(Open market) 매매를 보여줍니다.
조정 가격은 분할 조정된 가격입니다. 조정된 주식은 조정된 지분입니다.
내부자 매입 BAERW / Bridger Aerospace Group Holdings, Inc. - Equity Warrant: 단기 이익 분석
이 섹션에서는 ANNX / Annexon, Inc.에 대한 "공개 시장"(Open market)에서 계획되지 않은 내부자의 매입이 발생한 모든 상품의 수익성을 분석합니다. 이 분석은 내부자가 지속적으로 비정상적인 수익을 창출하는지 이해하는 데 도움이 되며, 이를 따를 가치가 있습니다. 이 분석은 각 거래 후 1년 동안 수행되며, 결과는 이론 값입니다.
아래 표는 사전 거래 계획(Automated trading plan)에 포함되지 않은 가장 최근의 공개 시장 매입을 보여줍니다.
| 거래일 | 티커 | 내부자 | 보고된 지분 |
보고된 가격 |
조정된 지분 |
조정된 가격 |
가격 기준 | 최고까지 일수 |
최고 가격 |
최고 이익 ($) |
최고 수익률 (%) |
|---|---|---|---|---|---|---|---|
| 이 내부자와 유가 증권의 조합과 관련하여 계획되지 않은 공개된 "공개 시장"(Open market) 거래는 없습니다. |
조정 가격은 분할 조정된 가격입니다. 조정된 주식은 조정된 지분입니다.
내부자 매매 BAERW / Bridger Aerospace Group Holdings, Inc. - Equity Warrant: 단기 손실 분석
이 섹션에서는 ANNX / Annexon, Inc.에서 이루어진 계획되지 않은 모든 공개 시장에서의 내부자 매도의 단기 손실 회피를 분석합니다. 일관된 손실 회피 패턴은 향후 매각 거래에서 가격 하락이 발생할 수도 있다는 것을 예측할 수 있습니다. 이 분석은 각 거래 후 1년을 대상으로 한 것이며, 결과는 이론 값입니다.
아래 표는 자동 거래 계획에 포함되지 않은 가장 최근의 "공개 시장"(Open market) 매매를 보여줍니다.
| 거래일 | 티커 | 내부자 | 보고된 지분 |
보고된 가격 |
조정된 지분 |
조정된 가격 |
가격 기준 | 최저까지 일수 |
최저에서 가격 |
회피된 최대 손실($) |
회피된 최대 손실율(%) |
|---|---|---|---|---|---|---|---|
| 이 내부자와 유가 증권의 조합과 관련하여 계획되지 않은 공개된 "공개 시장"(Open market) 거래는 없습니다. |
조정 가격은 분할 조정된 가격입니다. 조정된 주식은 조정된 지분입니다.
내부자 매입 CALC / CalciMedica, Inc.: 단기 이익 분석
이 섹션에서는 ANNX / Annexon, Inc.에 대한 "공개 시장"(Open market)에서 계획되지 않은 내부자의 매입이 발생한 모든 상품의 수익성을 분석합니다. 이 분석은 내부자가 지속적으로 비정상적인 수익을 창출하는지 이해하는 데 도움이 되며, 이를 따를 가치가 있습니다. 이 분석은 각 거래 후 1년 동안 수행되며, 결과는 이론 값입니다.
아래 표는 사전 거래 계획(Automated trading plan)에 포함되지 않은 가장 최근의 공개 시장 매입을 보여줍니다.
| 거래일 | 티커 | 내부자 | 보고된 지분 |
보고된 가격 |
조정된 지분 |
조정된 가격 |
가격 기준 | 최고까지 일수 |
최고 가격 |
최고 이익 ($) |
최고 수익률 (%) |
|---|---|---|---|---|---|---|---|---|---|---|---|
| 2020-09-29 | GRAY | Clarus Lifesciences III, L.P. | 250,000 | 16.0000 | 17,857 | 224.0000 | 4,000,000 | 115 | 490 | 4,749,930 | 118.75 |
조정 가격은 분할 조정된 가격입니다. 조정된 주식은 조정된 지분입니다.
내부자 매매 CALC / CalciMedica, Inc.: 단기 손실 분석
이 섹션에서는 ANNX / Annexon, Inc.에서 이루어진 계획되지 않은 모든 공개 시장에서의 내부자 매도의 단기 손실 회피를 분석합니다. 일관된 손실 회피 패턴은 향후 매각 거래에서 가격 하락이 발생할 수도 있다는 것을 예측할 수 있습니다. 이 분석은 각 거래 후 1년을 대상으로 한 것이며, 결과는 이론 값입니다.
아래 표는 자동 거래 계획에 포함되지 않은 가장 최근의 "공개 시장"(Open market) 매매를 보여줍니다.
| 거래일 | 티커 | 내부자 | 보고된 지분 |
보고된 가격 |
조정된 지분 |
조정된 가격 |
가격 기준 | 최저까지 일수 |
최저에서 가격 |
회피된 최대 손실($) |
회피된 최대 손실율(%) |
|---|---|---|---|---|---|---|---|
| 이 내부자와 유가 증권의 조합과 관련하여 계획되지 않은 공개된 "공개 시장"(Open market) 거래는 없습니다. |
조정 가격은 분할 조정된 가격입니다. 조정된 주식은 조정된 지분입니다.
내부자 매입 CQP / Cheniere Energy Partners, L.P. - Limited Partnership: 단기 이익 분석
이 섹션에서는 ANNX / Annexon, Inc.에 대한 "공개 시장"(Open market)에서 계획되지 않은 내부자의 매입이 발생한 모든 상품의 수익성을 분석합니다. 이 분석은 내부자가 지속적으로 비정상적인 수익을 창출하는지 이해하는 데 도움이 되며, 이를 따를 가치가 있습니다. 이 분석은 각 거래 후 1년 동안 수행되며, 결과는 이론 값입니다.
아래 표는 사전 거래 계획(Automated trading plan)에 포함되지 않은 가장 최근의 공개 시장 매입을 보여줍니다.
조정 가격은 분할 조정된 가격입니다. 조정된 주식은 조정된 지분입니다.
내부자 매매 CQP / Cheniere Energy Partners, L.P. - Limited Partnership: 단기 손실 분석
이 섹션에서는 ANNX / Annexon, Inc.에서 이루어진 계획되지 않은 모든 공개 시장에서의 내부자 매도의 단기 손실 회피를 분석합니다. 일관된 손실 회피 패턴은 향후 매각 거래에서 가격 하락이 발생할 수도 있다는 것을 예측할 수 있습니다. 이 분석은 각 거래 후 1년을 대상으로 한 것이며, 결과는 이론 값입니다.
아래 표는 자동 거래 계획에 포함되지 않은 가장 최근의 "공개 시장"(Open market) 매매를 보여줍니다.
| 거래일 | 티커 | 내부자 | 보고된 지분 |
보고된 가격 |
조정된 지분 |
조정된 가격 |
가격 기준 | 최저까지 일수 |
최저에서 가격 |
회피된 최대 손실($) |
회피된 최대 손실율(%) |
|---|---|---|---|---|---|---|---|
| 이 내부자와 유가 증권의 조합과 관련하여 계획되지 않은 공개된 "공개 시장"(Open market) 거래는 없습니다. |
조정 가격은 분할 조정된 가격입니다. 조정된 주식은 조정된 지분입니다.
내부자 매입 CRBD / Corebridge Financial, Inc. - Corporate Bond/Note: 단기 이익 분석
이 섹션에서는 ANNX / Annexon, Inc.에 대한 "공개 시장"(Open market)에서 계획되지 않은 내부자의 매입이 발생한 모든 상품의 수익성을 분석합니다. 이 분석은 내부자가 지속적으로 비정상적인 수익을 창출하는지 이해하는 데 도움이 되며, 이를 따를 가치가 있습니다. 이 분석은 각 거래 후 1년 동안 수행되며, 결과는 이론 값입니다.
아래 표는 사전 거래 계획(Automated trading plan)에 포함되지 않은 가장 최근의 공개 시장 매입을 보여줍니다.
| 거래일 | 티커 | 내부자 | 보고된 지분 |
보고된 가격 |
조정된 지분 |
조정된 가격 |
가격 기준 | 최고까지 일수 |
최고 가격 |
최고 이익 ($) |
최고 수익률 (%) |
|---|---|---|---|---|---|---|---|
| 이 내부자와 유가 증권의 조합과 관련하여 계획되지 않은 공개된 "공개 시장"(Open market) 거래는 없습니다. |
조정 가격은 분할 조정된 가격입니다. 조정된 주식은 조정된 지분입니다.
내부자 매매 CRBD / Corebridge Financial, Inc. - Corporate Bond/Note: 단기 손실 분석
이 섹션에서는 ANNX / Annexon, Inc.에서 이루어진 계획되지 않은 모든 공개 시장에서의 내부자 매도의 단기 손실 회피를 분석합니다. 일관된 손실 회피 패턴은 향후 매각 거래에서 가격 하락이 발생할 수도 있다는 것을 예측할 수 있습니다. 이 분석은 각 거래 후 1년을 대상으로 한 것이며, 결과는 이론 값입니다.
아래 표는 자동 거래 계획에 포함되지 않은 가장 최근의 "공개 시장"(Open market) 매매를 보여줍니다.
| 거래일 | 티커 | 내부자 | 보고된 지분 |
보고된 가격 |
조정된 지분 |
조정된 가격 |
가격 기준 | 최저까지 일수 |
최저에서 가격 |
회피된 최대 손실($) |
회피된 최대 손실율(%) |
|---|---|---|---|---|---|---|---|
| 이 내부자와 유가 증권의 조합과 관련하여 계획되지 않은 공개된 "공개 시장"(Open market) 거래는 없습니다. |
조정 가격은 분할 조정된 가격입니다. 조정된 주식은 조정된 지분입니다.
내부자 매입 CTOS / Custom Truck One Source, Inc.: 단기 이익 분석
이 섹션에서는 ANNX / Annexon, Inc.에 대한 "공개 시장"(Open market)에서 계획되지 않은 내부자의 매입이 발생한 모든 상품의 수익성을 분석합니다. 이 분석은 내부자가 지속적으로 비정상적인 수익을 창출하는지 이해하는 데 도움이 되며, 이를 따를 가치가 있습니다. 이 분석은 각 거래 후 1년 동안 수행되며, 결과는 이론 값입니다.
아래 표는 사전 거래 계획(Automated trading plan)에 포함되지 않은 가장 최근의 공개 시장 매입을 보여줍니다.
| 거래일 | 티커 | 내부자 | 보고된 지분 |
보고된 가격 |
조정된 지분 |
조정된 가격 |
가격 기준 | 최고까지 일수 |
최고 가격 |
최고 이익 ($) |
최고 수익률 (%) |
|---|---|---|---|---|---|---|---|
| 이 내부자와 유가 증권의 조합과 관련하여 계획되지 않은 공개된 "공개 시장"(Open market) 거래는 없습니다. |
조정 가격은 분할 조정된 가격입니다. 조정된 주식은 조정된 지분입니다.
내부자 매매 CTOS / Custom Truck One Source, Inc.: 단기 손실 분석
이 섹션에서는 ANNX / Annexon, Inc.에서 이루어진 계획되지 않은 모든 공개 시장에서의 내부자 매도의 단기 손실 회피를 분석합니다. 일관된 손실 회피 패턴은 향후 매각 거래에서 가격 하락이 발생할 수도 있다는 것을 예측할 수 있습니다. 이 분석은 각 거래 후 1년을 대상으로 한 것이며, 결과는 이론 값입니다.
아래 표는 자동 거래 계획에 포함되지 않은 가장 최근의 "공개 시장"(Open market) 매매를 보여줍니다.
조정 가격은 분할 조정된 가격입니다. 조정된 주식은 조정된 지분입니다.
내부자 매입 CYRX / Cryoport, Inc.: 단기 이익 분석
이 섹션에서는 ANNX / Annexon, Inc.에 대한 "공개 시장"(Open market)에서 계획되지 않은 내부자의 매입이 발생한 모든 상품의 수익성을 분석합니다. 이 분석은 내부자가 지속적으로 비정상적인 수익을 창출하는지 이해하는 데 도움이 되며, 이를 따를 가치가 있습니다. 이 분석은 각 거래 후 1년 동안 수행되며, 결과는 이론 값입니다.
아래 표는 사전 거래 계획(Automated trading plan)에 포함되지 않은 가장 최근의 공개 시장 매입을 보여줍니다.
| 거래일 | 티커 | 내부자 | 보고된 지분 |
보고된 가격 |
조정된 지분 |
조정된 가격 |
가격 기준 | 최고까지 일수 |
최고 가격 |
최고 이익 ($) |
최고 수익률 (%) |
|---|---|---|---|---|---|---|---|
| 이 내부자와 유가 증권의 조합과 관련하여 계획되지 않은 공개된 "공개 시장"(Open market) 거래는 없습니다. |
조정 가격은 분할 조정된 가격입니다. 조정된 주식은 조정된 지분입니다.
내부자 매매 CYRX / Cryoport, Inc.: 단기 손실 분석
이 섹션에서는 ANNX / Annexon, Inc.에서 이루어진 계획되지 않은 모든 공개 시장에서의 내부자 매도의 단기 손실 회피를 분석합니다. 일관된 손실 회피 패턴은 향후 매각 거래에서 가격 하락이 발생할 수도 있다는 것을 예측할 수 있습니다. 이 분석은 각 거래 후 1년을 대상으로 한 것이며, 결과는 이론 값입니다.
아래 표는 자동 거래 계획에 포함되지 않은 가장 최근의 "공개 시장"(Open market) 매매를 보여줍니다.
조정 가격은 분할 조정된 가격입니다. 조정된 주식은 조정된 지분입니다.
내부자 매입 FOA / Finance of America Companies Inc.: 단기 이익 분석
이 섹션에서는 ANNX / Annexon, Inc.에 대한 "공개 시장"(Open market)에서 계획되지 않은 내부자의 매입이 발생한 모든 상품의 수익성을 분석합니다. 이 분석은 내부자가 지속적으로 비정상적인 수익을 창출하는지 이해하는 데 도움이 되며, 이를 따를 가치가 있습니다. 이 분석은 각 거래 후 1년 동안 수행되며, 결과는 이론 값입니다.
아래 표는 사전 거래 계획(Automated trading plan)에 포함되지 않은 가장 최근의 공개 시장 매입을 보여줍니다.
| 거래일 | 티커 | 내부자 | 보고된 지분 |
보고된 가격 |
조정된 지분 |
조정된 가격 |
가격 기준 | 최고까지 일수 |
최고 가격 |
최고 이익 ($) |
최고 수익률 (%) |
|---|---|---|---|---|---|---|---|
| 이 내부자와 유가 증권의 조합과 관련하여 계획되지 않은 공개된 "공개 시장"(Open market) 거래는 없습니다. |
조정 가격은 분할 조정된 가격입니다. 조정된 주식은 조정된 지분입니다.
내부자 매매 FOA / Finance of America Companies Inc.: 단기 손실 분석
이 섹션에서는 ANNX / Annexon, Inc.에서 이루어진 계획되지 않은 모든 공개 시장에서의 내부자 매도의 단기 손실 회피를 분석합니다. 일관된 손실 회피 패턴은 향후 매각 거래에서 가격 하락이 발생할 수도 있다는 것을 예측할 수 있습니다. 이 분석은 각 거래 후 1년을 대상으로 한 것이며, 결과는 이론 값입니다.
아래 표는 자동 거래 계획에 포함되지 않은 가장 최근의 "공개 시장"(Open market) 매매를 보여줍니다.
조정 가격은 분할 조정된 가격입니다. 조정된 주식은 조정된 지분입니다.
내부자 매입 GRTX / Galera Therapeutics, Inc.: 단기 이익 분석
이 섹션에서는 ANNX / Annexon, Inc.에 대한 "공개 시장"(Open market)에서 계획되지 않은 내부자의 매입이 발생한 모든 상품의 수익성을 분석합니다. 이 분석은 내부자가 지속적으로 비정상적인 수익을 창출하는지 이해하는 데 도움이 되며, 이를 따를 가치가 있습니다. 이 분석은 각 거래 후 1년 동안 수행되며, 결과는 이론 값입니다.
아래 표는 사전 거래 계획(Automated trading plan)에 포함되지 않은 가장 최근의 공개 시장 매입을 보여줍니다.
조정 가격은 분할 조정된 가격입니다. 조정된 주식은 조정된 지분입니다.
내부자 매매 GRTX / Galera Therapeutics, Inc.: 단기 손실 분석
이 섹션에서는 ANNX / Annexon, Inc.에서 이루어진 계획되지 않은 모든 공개 시장에서의 내부자 매도의 단기 손실 회피를 분석합니다. 일관된 손실 회피 패턴은 향후 매각 거래에서 가격 하락이 발생할 수도 있다는 것을 예측할 수 있습니다. 이 분석은 각 거래 후 1년을 대상으로 한 것이며, 결과는 이론 값입니다.
아래 표는 자동 거래 계획에 포함되지 않은 가장 최근의 "공개 시장"(Open market) 매매를 보여줍니다.
| 거래일 | 티커 | 내부자 | 보고된 지분 |
보고된 가격 |
조정된 지분 |
조정된 가격 |
가격 기준 | 최저까지 일수 |
최저에서 가격 |
회피된 최대 손실($) |
회피된 최대 손실율(%) |
|---|---|---|---|---|---|---|---|
| 이 내부자와 유가 증권의 조합과 관련하여 계획되지 않은 공개된 "공개 시장"(Open market) 거래는 없습니다. |
조정 가격은 분할 조정된 가격입니다. 조정된 주식은 조정된 지분입니다.
내부자 매입 HPP / Hudson Pacific Properties, Inc.: 단기 이익 분석
이 섹션에서는 ANNX / Annexon, Inc.에 대한 "공개 시장"(Open market)에서 계획되지 않은 내부자의 매입이 발생한 모든 상품의 수익성을 분석합니다. 이 분석은 내부자가 지속적으로 비정상적인 수익을 창출하는지 이해하는 데 도움이 되며, 이를 따를 가치가 있습니다. 이 분석은 각 거래 후 1년 동안 수행되며, 결과는 이론 값입니다.
아래 표는 사전 거래 계획(Automated trading plan)에 포함되지 않은 가장 최근의 공개 시장 매입을 보여줍니다.
| 거래일 | 티커 | 내부자 | 보고된 지분 |
보고된 가격 |
조정된 지분 |
조정된 가격 |
가격 기준 | 최고까지 일수 |
최고 가격 |
최고 이익 ($) |
최고 수익률 (%) |
|---|---|---|---|---|---|---|---|
| 이 내부자와 유가 증권의 조합과 관련하여 계획되지 않은 공개된 "공개 시장"(Open market) 거래는 없습니다. |
조정 가격은 분할 조정된 가격입니다. 조정된 주식은 조정된 지분입니다.
내부자 매매 HPP / Hudson Pacific Properties, Inc.: 단기 손실 분석
이 섹션에서는 ANNX / Annexon, Inc.에서 이루어진 계획되지 않은 모든 공개 시장에서의 내부자 매도의 단기 손실 회피를 분석합니다. 일관된 손실 회피 패턴은 향후 매각 거래에서 가격 하락이 발생할 수도 있다는 것을 예측할 수 있습니다. 이 분석은 각 거래 후 1년을 대상으로 한 것이며, 결과는 이론 값입니다.
아래 표는 자동 거래 계획에 포함되지 않은 가장 최근의 "공개 시장"(Open market) 매매를 보여줍니다.
조정 가격은 분할 조정된 가격입니다. 조정된 주식은 조정된 지분입니다.
내부자 매입 LQ / Simplify Exchange Traded Funds - Simplify Tax Aware Alternatives ETF: 단기 이익 분석
이 섹션에서는 ANNX / Annexon, Inc.에 대한 "공개 시장"(Open market)에서 계획되지 않은 내부자의 매입이 발생한 모든 상품의 수익성을 분석합니다. 이 분석은 내부자가 지속적으로 비정상적인 수익을 창출하는지 이해하는 데 도움이 되며, 이를 따를 가치가 있습니다. 이 분석은 각 거래 후 1년 동안 수행되며, 결과는 이론 값입니다.
아래 표는 사전 거래 계획(Automated trading plan)에 포함되지 않은 가장 최근의 공개 시장 매입을 보여줍니다.
| 거래일 | 티커 | 내부자 | 보고된 지분 |
보고된 가격 |
조정된 지분 |
조정된 가격 |
가격 기준 | 최고까지 일수 |
최고 가격 |
최고 이익 ($) |
최고 수익률 (%) |
|---|---|---|---|---|---|---|---|
| 이 내부자와 유가 증권의 조합과 관련하여 계획되지 않은 공개된 "공개 시장"(Open market) 거래는 없습니다. |
조정 가격은 분할 조정된 가격입니다. 조정된 주식은 조정된 지분입니다.
내부자 매매 LQ / Simplify Exchange Traded Funds - Simplify Tax Aware Alternatives ETF: 단기 손실 분석
이 섹션에서는 ANNX / Annexon, Inc.에서 이루어진 계획되지 않은 모든 공개 시장에서의 내부자 매도의 단기 손실 회피를 분석합니다. 일관된 손실 회피 패턴은 향후 매각 거래에서 가격 하락이 발생할 수도 있다는 것을 예측할 수 있습니다. 이 분석은 각 거래 후 1년을 대상으로 한 것이며, 결과는 이론 값입니다.
아래 표는 자동 거래 계획에 포함되지 않은 가장 최근의 "공개 시장"(Open market) 매매를 보여줍니다.
조정 가격은 분할 조정된 가격입니다. 조정된 주식은 조정된 지분입니다.
내부자 매입 PACK / Ranpak Holdings Corp.: 단기 이익 분석
이 섹션에서는 ANNX / Annexon, Inc.에 대한 "공개 시장"(Open market)에서 계획되지 않은 내부자의 매입이 발생한 모든 상품의 수익성을 분석합니다. 이 분석은 내부자가 지속적으로 비정상적인 수익을 창출하는지 이해하는 데 도움이 되며, 이를 따를 가치가 있습니다. 이 분석은 각 거래 후 1년 동안 수행되며, 결과는 이론 값입니다.
아래 표는 사전 거래 계획(Automated trading plan)에 포함되지 않은 가장 최근의 공개 시장 매입을 보여줍니다.
조정 가격은 분할 조정된 가격입니다. 조정된 주식은 조정된 지분입니다.
내부자 매매 PACK / Ranpak Holdings Corp.: 단기 손실 분석
이 섹션에서는 ANNX / Annexon, Inc.에서 이루어진 계획되지 않은 모든 공개 시장에서의 내부자 매도의 단기 손실 회피를 분석합니다. 일관된 손실 회피 패턴은 향후 매각 거래에서 가격 하락이 발생할 수도 있다는 것을 예측할 수 있습니다. 이 분석은 각 거래 후 1년을 대상으로 한 것이며, 결과는 이론 값입니다.
아래 표는 자동 거래 계획에 포함되지 않은 가장 최근의 "공개 시장"(Open market) 매매를 보여줍니다.
조정 가격은 분할 조정된 가격입니다. 조정된 주식은 조정된 지분입니다.
내부자 매입 PBF / PBF Energy Inc.: 단기 이익 분석
이 섹션에서는 ANNX / Annexon, Inc.에 대한 "공개 시장"(Open market)에서 계획되지 않은 내부자의 매입이 발생한 모든 상품의 수익성을 분석합니다. 이 분석은 내부자가 지속적으로 비정상적인 수익을 창출하는지 이해하는 데 도움이 되며, 이를 따를 가치가 있습니다. 이 분석은 각 거래 후 1년 동안 수행되며, 결과는 이론 값입니다.
아래 표는 사전 거래 계획(Automated trading plan)에 포함되지 않은 가장 최근의 공개 시장 매입을 보여줍니다.
| 거래일 | 티커 | 내부자 | 보고된 지분 |
보고된 가격 |
조정된 지분 |
조정된 가격 |
가격 기준 | 최고까지 일수 |
최고 가격 |
최고 이익 ($) |
최고 수익률 (%) |
|---|---|---|---|---|---|---|---|
| 이 내부자와 유가 증권의 조합과 관련하여 계획되지 않은 공개된 "공개 시장"(Open market) 거래는 없습니다. |
조정 가격은 분할 조정된 가격입니다. 조정된 주식은 조정된 지분입니다.
내부자 매매 PBF / PBF Energy Inc.: 단기 손실 분석
이 섹션에서는 ANNX / Annexon, Inc.에서 이루어진 계획되지 않은 모든 공개 시장에서의 내부자 매도의 단기 손실 회피를 분석합니다. 일관된 손실 회피 패턴은 향후 매각 거래에서 가격 하락이 발생할 수도 있다는 것을 예측할 수 있습니다. 이 분석은 각 거래 후 1년을 대상으로 한 것이며, 결과는 이론 값입니다.
아래 표는 자동 거래 계획에 포함되지 않은 가장 최근의 "공개 시장"(Open market) 매매를 보여줍니다.
조정 가격은 분할 조정된 가격입니다. 조정된 주식은 조정된 지분입니다.
내부자 매입 PFGC / Performance Food Group Company: 단기 이익 분석
이 섹션에서는 ANNX / Annexon, Inc.에 대한 "공개 시장"(Open market)에서 계획되지 않은 내부자의 매입이 발생한 모든 상품의 수익성을 분석합니다. 이 분석은 내부자가 지속적으로 비정상적인 수익을 창출하는지 이해하는 데 도움이 되며, 이를 따를 가치가 있습니다. 이 분석은 각 거래 후 1년 동안 수행되며, 결과는 이론 값입니다.
아래 표는 사전 거래 계획(Automated trading plan)에 포함되지 않은 가장 최근의 공개 시장 매입을 보여줍니다.
| 거래일 | 티커 | 내부자 | 보고된 지분 |
보고된 가격 |
조정된 지분 |
조정된 가격 |
가격 기준 | 최고까지 일수 |
최고 가격 |
최고 이익 ($) |
최고 수익률 (%) |
|---|---|---|---|---|---|---|---|
| 이 내부자와 유가 증권의 조합과 관련하여 계획되지 않은 공개된 "공개 시장"(Open market) 거래는 없습니다. |
조정 가격은 분할 조정된 가격입니다. 조정된 주식은 조정된 지분입니다.
내부자 매매 PFGC / Performance Food Group Company: 단기 손실 분석
이 섹션에서는 ANNX / Annexon, Inc.에서 이루어진 계획되지 않은 모든 공개 시장에서의 내부자 매도의 단기 손실 회피를 분석합니다. 일관된 손실 회피 패턴은 향후 매각 거래에서 가격 하락이 발생할 수도 있다는 것을 예측할 수 있습니다. 이 분석은 각 거래 후 1년을 대상으로 한 것이며, 결과는 이론 값입니다.
아래 표는 자동 거래 계획에 포함되지 않은 가장 최근의 "공개 시장"(Open market) 매매를 보여줍니다.
| 거래일 | 티커 | 내부자 | 보고된 지분 |
보고된 가격 |
조정된 지분 |
조정된 가격 |
가격 기준 | 최저까지 일수 |
최저에서 가격 |
회피된 최대 손실($) |
회피된 최대 손실율(%) |
|---|---|---|---|---|---|---|---|
| 이 내부자와 유가 증권의 조합과 관련하여 계획되지 않은 공개된 "공개 시장"(Open market) 거래는 없습니다. |
조정 가격은 분할 조정된 가격입니다. 조정된 주식은 조정된 지분입니다.
내부자 매입 PRAX / Praxis Precision Medicines, Inc.: 단기 이익 분석
이 섹션에서는 ANNX / Annexon, Inc.에 대한 "공개 시장"(Open market)에서 계획되지 않은 내부자의 매입이 발생한 모든 상품의 수익성을 분석합니다. 이 분석은 내부자가 지속적으로 비정상적인 수익을 창출하는지 이해하는 데 도움이 되며, 이를 따를 가치가 있습니다. 이 분석은 각 거래 후 1년 동안 수행되며, 결과는 이론 값입니다.
아래 표는 사전 거래 계획(Automated trading plan)에 포함되지 않은 가장 최근의 공개 시장 매입을 보여줍니다.
| 거래일 | 티커 | 내부자 | 보고된 지분 |
보고된 가격 |
조정된 지분 |
조정된 가격 |
가격 기준 | 최고까지 일수 |
최고 가격 |
최고 이익 ($) |
최고 수익률 (%) |
|---|---|---|---|---|---|---|---|
| 이 내부자와 유가 증권의 조합과 관련하여 계획되지 않은 공개된 "공개 시장"(Open market) 거래는 없습니다. |
조정 가격은 분할 조정된 가격입니다. 조정된 주식은 조정된 지분입니다.
내부자 매매 PRAX / Praxis Precision Medicines, Inc.: 단기 손실 분석
이 섹션에서는 ANNX / Annexon, Inc.에서 이루어진 계획되지 않은 모든 공개 시장에서의 내부자 매도의 단기 손실 회피를 분석합니다. 일관된 손실 회피 패턴은 향후 매각 거래에서 가격 하락이 발생할 수도 있다는 것을 예측할 수 있습니다. 이 분석은 각 거래 후 1년을 대상으로 한 것이며, 결과는 이론 값입니다.
아래 표는 자동 거래 계획에 포함되지 않은 가장 최근의 "공개 시장"(Open market) 매매를 보여줍니다.
조정 가격은 분할 조정된 가격입니다. 조정된 주식은 조정된 지분입니다.
내부자 매입 SN / SharkNinja, Inc.: 단기 이익 분석
이 섹션에서는 ANNX / Annexon, Inc.에 대한 "공개 시장"(Open market)에서 계획되지 않은 내부자의 매입이 발생한 모든 상품의 수익성을 분석합니다. 이 분석은 내부자가 지속적으로 비정상적인 수익을 창출하는지 이해하는 데 도움이 되며, 이를 따를 가치가 있습니다. 이 분석은 각 거래 후 1년 동안 수행되며, 결과는 이론 값입니다.
아래 표는 사전 거래 계획(Automated trading plan)에 포함되지 않은 가장 최근의 공개 시장 매입을 보여줍니다.
| 거래일 | 티커 | 내부자 | 보고된 지분 |
보고된 가격 |
조정된 지분 |
조정된 가격 |
가격 기준 | 최고까지 일수 |
최고 가격 |
최고 이익 ($) |
최고 수익률 (%) |
|---|---|---|---|---|---|---|---|
| 이 내부자와 유가 증권의 조합과 관련하여 계획되지 않은 공개된 "공개 시장"(Open market) 거래는 없습니다. |
조정 가격은 분할 조정된 가격입니다. 조정된 주식은 조정된 지분입니다.
내부자 매매 SN / SharkNinja, Inc.: 단기 손실 분석
이 섹션에서는 ANNX / Annexon, Inc.에서 이루어진 계획되지 않은 모든 공개 시장에서의 내부자 매도의 단기 손실 회피를 분석합니다. 일관된 손실 회피 패턴은 향후 매각 거래에서 가격 하락이 발생할 수도 있다는 것을 예측할 수 있습니다. 이 분석은 각 거래 후 1년을 대상으로 한 것이며, 결과는 이론 값입니다.
아래 표는 자동 거래 계획에 포함되지 않은 가장 최근의 "공개 시장"(Open market) 매매를 보여줍니다.
| 거래일 | 티커 | 내부자 | 보고된 지분 |
보고된 가격 |
조정된 지분 |
조정된 가격 |
가격 기준 | 최저까지 일수 |
최저에서 가격 |
회피된 최대 손실($) |
회피된 최대 손실율(%) |
|---|---|---|---|---|---|---|---|
| 이 내부자와 유가 증권의 조합과 관련하여 계획되지 않은 공개된 "공개 시장"(Open market) 거래는 없습니다. |
조정 가격은 분할 조정된 가격입니다. 조정된 주식은 조정된 지분입니다.
내부자 매입 TGE / The Generation Essentials Group: 단기 이익 분석
이 섹션에서는 ANNX / Annexon, Inc.에 대한 "공개 시장"(Open market)에서 계획되지 않은 내부자의 매입이 발생한 모든 상품의 수익성을 분석합니다. 이 분석은 내부자가 지속적으로 비정상적인 수익을 창출하는지 이해하는 데 도움이 되며, 이를 따를 가치가 있습니다. 이 분석은 각 거래 후 1년 동안 수행되며, 결과는 이론 값입니다.
아래 표는 사전 거래 계획(Automated trading plan)에 포함되지 않은 가장 최근의 공개 시장 매입을 보여줍니다.
| 거래일 | 티커 | 내부자 | 보고된 지분 |
보고된 가격 |
조정된 지분 |
조정된 가격 |
가격 기준 | 최고까지 일수 |
최고 가격 |
최고 이익 ($) |
최고 수익률 (%) |
|---|---|---|---|---|---|---|---|
| 이 내부자와 유가 증권의 조합과 관련하여 계획되지 않은 공개된 "공개 시장"(Open market) 거래는 없습니다. |
조정 가격은 분할 조정된 가격입니다. 조정된 주식은 조정된 지분입니다.
내부자 매매 TGE / The Generation Essentials Group: 단기 손실 분석
이 섹션에서는 ANNX / Annexon, Inc.에서 이루어진 계획되지 않은 모든 공개 시장에서의 내부자 매도의 단기 손실 회피를 분석합니다. 일관된 손실 회피 패턴은 향후 매각 거래에서 가격 하락이 발생할 수도 있다는 것을 예측할 수 있습니다. 이 분석은 각 거래 후 1년을 대상으로 한 것이며, 결과는 이론 값입니다.
아래 표는 자동 거래 계획에 포함되지 않은 가장 최근의 "공개 시장"(Open market) 매매를 보여줍니다.
| 거래일 | 티커 | 내부자 | 보고된 지분 |
보고된 가격 |
조정된 지분 |
조정된 가격 |
가격 기준 | 최저까지 일수 |
최저에서 가격 |
회피된 최대 손실($) |
회피된 최대 손실율(%) |
|---|---|---|---|---|---|---|---|
| 이 내부자와 유가 증권의 조합과 관련하여 계획되지 않은 공개된 "공개 시장"(Open market) 거래는 없습니다. |
조정 가격은 분할 조정된 가격입니다. 조정된 주식은 조정된 지분입니다.
내부자 매입 UAN / CVR Partners, LP - Limited Partnership: 단기 이익 분석
이 섹션에서는 ANNX / Annexon, Inc.에 대한 "공개 시장"(Open market)에서 계획되지 않은 내부자의 매입이 발생한 모든 상품의 수익성을 분석합니다. 이 분석은 내부자가 지속적으로 비정상적인 수익을 창출하는지 이해하는 데 도움이 되며, 이를 따를 가치가 있습니다. 이 분석은 각 거래 후 1년 동안 수행되며, 결과는 이론 값입니다.
아래 표는 사전 거래 계획(Automated trading plan)에 포함되지 않은 가장 최근의 공개 시장 매입을 보여줍니다.
| 거래일 | 티커 | 내부자 | 보고된 지분 |
보고된 가격 |
조정된 지분 |
조정된 가격 |
가격 기준 | 최고까지 일수 |
최고 가격 |
최고 이익 ($) |
최고 수익률 (%) |
|---|---|---|---|---|---|---|---|
| 이 내부자와 유가 증권의 조합과 관련하여 계획되지 않은 공개된 "공개 시장"(Open market) 거래는 없습니다. |
조정 가격은 분할 조정된 가격입니다. 조정된 주식은 조정된 지분입니다.
내부자 매매 UAN / CVR Partners, LP - Limited Partnership: 단기 손실 분석
이 섹션에서는 ANNX / Annexon, Inc.에서 이루어진 계획되지 않은 모든 공개 시장에서의 내부자 매도의 단기 손실 회피를 분석합니다. 일관된 손실 회피 패턴은 향후 매각 거래에서 가격 하락이 발생할 수도 있다는 것을 예측할 수 있습니다. 이 분석은 각 거래 후 1년을 대상으로 한 것이며, 결과는 이론 값입니다.
아래 표는 자동 거래 계획에 포함되지 않은 가장 최근의 "공개 시장"(Open market) 매매를 보여줍니다.
| 거래일 | 티커 | 내부자 | 보고된 지분 |
보고된 가격 |
조정된 지분 |
조정된 가격 |
가격 기준 | 최저까지 일수 |
최저에서 가격 |
회피된 최대 손실($) |
회피된 최대 손실율(%) |
|---|---|---|---|---|---|---|---|
| 이 내부자와 유가 증권의 조합과 관련하여 계획되지 않은 공개된 "공개 시장"(Open market) 거래는 없습니다. |
조정 가격은 분할 조정된 가격입니다. 조정된 주식은 조정된 지분입니다.
내부자 매입 WGSWW / GeneDx Holdings Corp. - Equity Warrant: 단기 이익 분석
이 섹션에서는 ANNX / Annexon, Inc.에 대한 "공개 시장"(Open market)에서 계획되지 않은 내부자의 매입이 발생한 모든 상품의 수익성을 분석합니다. 이 분석은 내부자가 지속적으로 비정상적인 수익을 창출하는지 이해하는 데 도움이 되며, 이를 따를 가치가 있습니다. 이 분석은 각 거래 후 1년 동안 수행되며, 결과는 이론 값입니다.
아래 표는 사전 거래 계획(Automated trading plan)에 포함되지 않은 가장 최근의 공개 시장 매입을 보여줍니다.
조정 가격은 분할 조정된 가격입니다. 조정된 주식은 조정된 지분입니다.
내부자 매매 WGSWW / GeneDx Holdings Corp. - Equity Warrant: 단기 손실 분석
이 섹션에서는 ANNX / Annexon, Inc.에서 이루어진 계획되지 않은 모든 공개 시장에서의 내부자 매도의 단기 손실 회피를 분석합니다. 일관된 손실 회피 패턴은 향후 매각 거래에서 가격 하락이 발생할 수도 있다는 것을 예측할 수 있습니다. 이 분석은 각 거래 후 1년을 대상으로 한 것이며, 결과는 이론 값입니다.
아래 표는 자동 거래 계획에 포함되지 않은 가장 최근의 "공개 시장"(Open market) 매매를 보여줍니다.
| 거래일 | 티커 | 내부자 | 보고된 지분 |
보고된 가격 |
조정된 지분 |
조정된 가격 |
가격 기준 | 최저까지 일수 |
최저에서 가격 |
회피된 최대 손실($) |
회피된 최대 손실율(%) |
|---|---|---|---|---|---|---|---|
| 이 내부자와 유가 증권의 조합과 관련하여 계획되지 않은 공개된 "공개 시장"(Open market) 거래는 없습니다. |
조정 가격은 분할 조정된 가격입니다. 조정된 주식은 조정된 지분입니다.
내부자의 매매 거래 내역
아래 표는 증권거래위원회(SEC)에 공시된 Blackstone Holdings II L.P.의 내부자의 전체 거래 목록입니다.
| 보고일 | 거래일 | 보고 | 티커 | 증권 | 코드 | 지분 | 잔여 지분 | 변동률 (%) |
지분 가치 |
거래 가치 |
잔여 가치 |
|
|---|---|---|---|---|---|---|---|---|---|---|---|---|
| 2026-06-01 |
|
4 | MDLN |
Medline Inc.
Class A Common Stock |
J - Other | -438,214 | 1,990,467 | -18.04 | ||||
| 2026-06-01 |
|
4 | MDLN |
Medline Inc.
Class A Common Stock |
S - Sale | -1,489,924 | 1,539 | -99.90 | 36.54 | -54,438,098 | 56,231 | |
| 2026-06-01 |
|
4 | MDLN |
Medline Inc.
Class A Common Stock |
S - Sale | -2,256,800 | 10,250,904 | -18.04 | 36.54 | -82,457,830 | 374,542,405 | |
| 2026-06-01 |
|
4 | MDLN |
Medline Inc.
Class A Common Stock |
S - Sale | -9,858,774 | 10,185 | -99.90 | 36.54 | -360,214,955 | 372,134 | |
| 2026-06-01 |
|
4 | MDLN |
Medline Inc.
Class A Common Stock |
S - Sale | -19,712,326 | 89,537,913 | -18.04 | 36.54 | -720,239,111 | 3,271,491,496 | |
| 2026-05-26 |
|
4 | MDLN |
Medline Inc.
Class B Common Stock |
J - Other | -1,489,924 | 6,766,039 | -18.05 | ||||
| 2026-05-26 |
|
4 | MDLN |
Medline Inc.
Class B Common Stock |
J - Other | -9,858,774 | 44,770,628 | -18.05 | ||||
| 2026-05-26 |
|
4 | MDLN |
Medline Inc.
Class A Common Stock |
C - Conversion | 1,489,924 | 1,491,463 | 96,811.18 | ||||
| 2026-05-26 |
|
4 | MDLN |
Medline Inc.
Class A Common Stock |
C - Conversion | 9,858,774 | 9,868,959 | 96,797.00 | ||||
| 2026-04-09 |
|
4 | LGN |
Legence Corp.
Class A Common Stock |
S - Sale | -5,865,413 | 19,297,381 | -23.31 | 54.00 | -316,732,302 | 1,042,058,574 | |
| 2026-04-09 |
|
4 | LGN |
Legence Corp.
Class A Common Stock |
S - Sale | -9,528,699 | 178,571 | -98.16 | 54.00 | -514,549,746 | 9,642,834 | |
| 2026-04-09 |
|
4 | LGN |
Legence Corp.
Class B Common Stock |
C - Conversion | -9,528,699 | 31,171,134 | -23.41 | ||||
| 2026-04-09 |
|
4 | LGN |
Legence Corp.
Class A Common Stock |
C - Conversion | 9,528,699 | 9,707,270 | 5,336.08 | ||||
| 2026-03-19 |
|
4 | BMBL |
Bumble Inc.
Class A Common Stock |
S - Sale | -6,459 | 25,832 | -20.00 | 3.51 | -22,671 | 90,670 | |
| 2026-03-19 |
|
4 | BMBL |
Bumble Inc.
Class A Common Stock |
S - Sale | -29,575 | 118,296 | -20.00 | 3.51 | -103,808 | 415,219 | |
| 2026-03-19 |
|
4 | BMBL |
Bumble Inc.
Class A Common Stock |
S - Sale | -3,278,961 | 13,115,843 | -20.00 | 3.51 | -11,509,153 | 46,036,609 | |
| 2026-03-19 |
|
4 | BMBL |
Bumble Inc.
Class A Common Stock |
S - Sale | -1,080,903 | 4,323,608 | -20.00 | 3.51 | -3,793,970 | 15,175,864 | |
| 2026-03-19 |
|
4 | BMBL |
Bumble Inc.
Class A Common Stock |
S - Sale | -405,073 | 1,620,290 | -20.00 | 3.51 | -1,421,806 | 5,687,218 | |
| 2026-03-19 |
|
4 | BMBL |
Bumble Inc.
Class A Common Stock |
S - Sale | -2,495,189 | 9,980,754 | -20.00 | 3.51 | -8,758,113 | 35,032,447 | |
| 2026-03-19 |
|
4 | BMBL |
Bumble Inc.
Class A Common Stock |
S - Sale | -181,344 | 725,373 | -20.00 | 3.51 | -636,517 | 2,546,059 | |
| 2026-03-12 |
|
4 | MDLN |
Medline Inc.
Class A Common Stock |
J - Other | -366,337 | 2,428,681 | -13.11 | ||||
| 2026-03-12 |
|
4 | MDLN |
Medline Inc.
Class A Common Stock |
S - Sale | -1,245,544 | 1,539 | -99.88 | 40.51 | -50,454,496 | 62,342 | |
| 2026-03-12 |
|
4 | MDLN |
Medline Inc.
Class A Common Stock |
S - Sale | -1,886,636 | 12,507,704 | -13.11 | 40.51 | -76,423,851 | 506,662,074 | |
| 2026-03-12 |
|
4 | MDLN |
Medline Inc.
Class A Common Stock |
S - Sale | -8,241,723 | 10,185 | -99.88 | 40.51 | -333,855,715 | 412,574 | |
| 2026-03-12 |
|
4 | MDLN |
Medline Inc.
Class A Common Stock |
S - Sale | -16,479,083 | 109,250,239 | -13.11 | 40.51 | -667,534,694 | 4,425,508,681 | |
| 2026-03-06 |
|
4 | MDLN |
Medline Inc.
Class B Common Stock |
J - Other | -162,462 | 8,255,963 | -1.93 | ||||
| 2026-03-06 |
|
4 | MDLN |
Medline Inc.
Class B Common Stock |
J - Other | -1,075,007 | 54,629,402 | -1.93 | ||||
| 2026-03-06 |
|
4 | MDLN |
Medline Inc.
Class A Common Stock |
C - Conversion | 162,462 | 1,247,083 | 14.98 | ||||
| 2026-03-06 |
|
4 | MDLN |
Medline Inc.
Class A Common Stock |
C - Conversion | 1,075,007 | 8,251,908 | 14.98 | ||||
| 2026-03-06 |
|
4 | MDLN |
Medline Inc.
Class B Common Stock |
J - Other | -1,083,082 | 8,418,425 | -11.40 | ||||
| 2026-03-06 |
|
4 | MDLN |
Medline Inc.
Class B Common Stock |
J - Other | -7,166,716 | 55,704,409 | -11.40 | ||||
| 2026-03-06 |
|
4 | MDLN |
Medline Inc.
Class A Common Stock |
C - Conversion | 1,083,082 | 1,084,621 | 70,375.70 | ||||
| 2026-03-06 |
|
4 | MDLN |
Medline Inc.
Class A Common Stock |
C - Conversion | 7,166,716 | 7,176,901 | 70,365.40 | ||||
| 2026-03-03 |
|
4 | FOA |
Finance of America Companies Inc.
Class B Common Stock |
S - Sale | -1 | 0 | -100.00 | ||||
| 2026-03-03 |
|
4 | FOA |
Finance of America Companies Inc.
Class B Common Stock |
S - Sale | -1 | 0 | -100.00 | ||||
| 2026-03-03 |
|
4 | FOA |
Finance of America Companies Inc.
Class A Common Stock |
S - Sale | -1,208,126 | 0 | -100.00 | 10.00 | -12,081,260 | ||
| 2026-03-03 |
|
4 | FOA |
Finance of America Companies Inc.
Class A Common Stock |
S - Sale | -2,161 | 0 | -100.00 | 10.00 | -21,610 | ||
| 2026-03-03 |
|
4 | FOA |
Finance of America Companies Inc.
Class A Common Stock |
S - Sale | -385,855 | 0 | -100.00 | 10.00 | -3,858,550 | ||
| 2026-01-08 |
|
4 | LGN |
Legence Corp.
Class A Common Stock |
S - Sale | -480,205 | 25,162,794 | -1.87 | 45.00 | -21,609,225 | 1,132,325,730 | |
| 2026-01-08 |
|
4 | LGN |
Legence Corp.
Class A Common Stock |
S - Sale | -780,121 | 178,571 | -81.37 | 45.00 | -35,105,445 | 8,035,695 | |
| 2026-01-08 |
|
4 | LGN |
Legence Corp.
Class B Common Stock |
C - Conversion | -780,121 | 40,699,833 | -1.88 | ||||
| 2026-01-08 |
|
4 | LGN |
Legence Corp.
Class A Common Stock |
C - Conversion | 780,121 | 958,692 | 436.87 | ||||
| 2025-12-22 |
|
4 | MDLN |
Medline Inc.
Class A Common Stock |
J - Other | -268,536 | 142,918,680 | -0.19 | ||||
| 2025-12-22 |
|
4 | MDLN |
Medline Inc.
Class B Common Stock |
J - Other | -6,954,440 | 72,372,632 | -8.77 | ||||
| 2025-12-22 |
|
4 | MDLN |
Medline Inc.
Class A Common Stock |
S - Sale | -13,462,600 | 143,187,216 | -8.59 | 28.37 | -381,911,076 | 4,061,977,900 | |
| 2025-12-17 | 3 | MDLN |
Medline Inc.
Class A Common Stock |
156,649,816 | ||||||||
| 2025-12-17 | 3 | MDLN |
Medline Inc.
Class A Common Stock |
11,724 | ||||||||
| 2025-12-17 | 3 | MDLN |
Medline Inc.
Class B Common Stock |
79,327,072 | ||||||||
| 2025-12-16 |
|
4 | LGN |
Legence Corp.
Class A Common Stock |
S - Sale | -3,201,370 | 25,642,999 | -11.10 | 45.00 | -144,061,650 | 1,153,934,955 | |
| 2025-12-16 |
|
4 | LGN |
Legence Corp.
Class A Common Stock |
S - Sale | -5,200,808 | 178,571 | -96.68 | 45.00 | -234,036,360 | 8,035,695 | |
| 2025-12-16 |
|
4 | LGN |
Legence Corp.
Class B Common Stock |
C - Conversion | -5,200,808 | 41,479,954 | -11.14 | ||||
| 2025-12-16 |
|
4 | LGN |
Legence Corp.
Class A Common Stock |
C - Conversion | 5,200,808 | 5,379,379 | 2,912.46 | ||||
| 2025-12-08 |
|
4 | FOA |
Finance of America Companies Inc.
Class A Common Stock |
S - Sale | -1,208,126 | 1,208,126 | -50.00 | 10.00 | -12,081,260 | 12,081,260 | |
| 2025-12-08 |
|
4 | FOA |
Finance of America Companies Inc.
Class A Common Stock |
S - Sale | -2,161 | 2,161 | -50.00 | 10.00 | -21,610 | 21,610 | |
| 2025-12-08 |
|
4 | FOA |
Finance of America Companies Inc.
Class A Common Stock |
S - Sale | -385,855 | 385,855 | -50.00 | 10.00 | -3,858,550 | 3,858,550 | |
| 2025-11-05 |
|
4 | BMBL |
Bumble Inc.
Class B Common Stock |
J - Other | -1 | 0 | -100.00 | ||||
| 2025-11-05 |
|
4 | BMBL |
Bumble Inc.
Class B Common Stock |
J - Other | -1 | 0 | -100.00 | ||||
| 2025-11-05 |
|
4 | BMBL |
Bumble Inc.
Class B Common Stock |
J - Other | -1 | 0 | -100.00 | ||||
| 2025-11-05 |
|
4 | BMBL |
Bumble Inc.
Class A Common Stock |
C - Conversion | 32,291 | 32,291 | |||||
| 2025-11-05 |
|
4 | BMBL |
Bumble Inc.
Class A Common Stock |
C - Conversion | 147,871 | 147,871 | |||||
| 2025-11-05 |
|
4 | BMBL |
Bumble Inc.
Class A Common Stock |
C - Conversion | 16,385,953 | 16,394,804 | 185,131.09 | ||||
| 2025-09-11 | 3 | LGN |
Legence Corp.
Class A Common Stock |
178,571 | ||||||||
| 2025-09-11 | 3 | LGN |
Legence Corp.
Class A Common Stock |
28,844,369 | ||||||||
| 2025-09-11 | 3 | LGN |
Legence Corp.
Class B Common Stock |
46,680,762 | ||||||||
| 2025-08-15 |
|
4 | BMBL |
Bumble Inc.
Class A Common Stock |
S - Sale | -2,412,589 | 5,404,511 | -30.86 | 6.26 | -15,102,807 | 33,832,239 | |
| 2025-08-15 |
|
4 | BMBL |
Bumble Inc.
Class A Common Stock |
S - Sale | -904,128 | 2,025,363 | -30.86 | 6.26 | -5,659,841 | 12,678,772 | |
| 2025-08-15 |
|
4 | BMBL |
Bumble Inc.
Class A Common Stock |
S - Sale | -5,569,296 | 12,475,943 | -30.86 | 6.26 | -34,863,793 | 78,099,403 | |
| 2025-08-15 |
|
4 | BMBL |
Bumble Inc.
Class A Common Stock |
S - Sale | -404,761 | 906,717 | -30.86 | 6.26 | -2,533,804 | 5,676,048 | |
| 2025-08-15 |
|
4 | BMBL |
Bumble Inc.
Class A Common Stock |
S - Sale | -14,415 | 0 | -100.00 | 6.26 | -90,238 | ||
| 2025-08-15 |
|
4 | BMBL |
Bumble Inc.
Class A Common Stock |
S - Sale | -66,010 | 0 | -100.00 | 6.26 | -413,223 | ||
| 2025-08-15 |
|
4 | BMBL |
Bumble Inc.
Class A Common Stock |
S - Sale | -7,318,685 | 8,851 | -99.88 | 6.26 | -45,814,968 | 55,407 | |
| 2025-08-15 |
|
4 | BMBL |
Bumble Inc.
Class A Common Stock |
C - Conversion | 14,415 | 14,415 | |||||
| 2025-08-15 |
|
4 | BMBL |
Bumble Inc.
Class A Common Stock |
C - Conversion | 66,010 | 66,010 | |||||
| 2025-08-15 |
|
4 | BMBL |
Bumble Inc.
Class A Common Stock |
C - Conversion | 7,314,734 | 7,327,536 | 57,137.43 | ||||
| 2025-04-18 |
|
4 | AMPS |
Altus Power, Inc.
Class A Common Stock |
D - Sale to Issuer | -21,116,125 | 0 | -100.00 | 5.00 | -105,580,625 | ||
| 2024-05-10 | 3 | CRBG |
Corebridge Financial, Inc.
Common stock, par value $0.01 per share |
61,962,123 | ||||||||
| 2024-04-03 |
|
4 | FOA |
Finance of America Companies Inc.
Class A Common Stock |
J - Other | -172,491 | 24,162,521 | -0.71 | ||||
| 2024-04-03 |
|
4 | FOA |
Finance of America Companies Inc.
Class A Common Stock |
J - Other | -2,262 | 43,228 | -4.97 | ||||
| 2024-04-03 |
|
4 | FOA |
Finance of America Companies Inc.
Class A Common Stock |
C - Conversion | 2,262 | 45,490 | 5.23 | ||||
| 2024-04-03 |
|
4 | FOA |
Finance of America Companies Inc.
Class A Common Stock |
J - Other | -394,081 | 7,717,103 | -4.86 | ||||
| 2024-04-03 |
|
4 | FOA |
Finance of America Companies Inc.
Class A Common Stock |
C - Conversion | 394,081 | 8,111,184 | 5.11 | ||||
| 2024-03-12 |
|
4 | FOA |
Finance of America Companies Inc.
Class A Common Stock |
J - Other | -14,913 | 24,335,012 | -0.06 | ||||
| 2024-03-12 |
|
4 | FOA |
Finance of America Companies Inc.
Class A Common Stock |
J - Other | -196 | 43,228 | -0.45 | ||||
| 2024-03-12 |
|
4 | FOA |
Finance of America Companies Inc.
Class A Common Stock |
C - Conversion | 196 | 43,424 | 0.45 | ||||
| 2024-03-12 |
|
4 | FOA |
Finance of America Companies Inc.
Class A Common Stock |
J - Other | -34,071 | 7,717,103 | -0.44 | ||||
| 2024-03-12 |
|
4 | FOA |
Finance of America Companies Inc.
Class A Common Stock |
C - Conversion | 34,071 | 7,751,174 | 0.44 | ||||
| 2024-03-05 |
|
4 | BMBL |
Bumble Inc.
Class A Common Stock |
S - Sale | -1,067 | 12,802 | -7.69 | 11.10 | -11,840 | 142,061 | |
| 2024-03-05 |
|
4 | BMBL |
Bumble Inc.
Class A Common Stock |
S - Sale | -651,332 | 7,817,100 | -7.69 | 11.10 | -7,227,701 | 86,744,795 | |
| 2024-03-05 |
|
4 | BMBL |
Bumble Inc.
Class A Common Stock |
S - Sale | -244,089 | 2,929,491 | -7.69 | 11.10 | -2,708,607 | 32,507,976 | |
| 2024-03-05 |
|
4 | BMBL |
Bumble Inc.
Class A Common Stock |
S - Sale | -1,503,554 | 18,045,239 | -7.69 | 11.10 | -16,684,638 | 200,244,408 | |
| 2024-03-05 |
|
4 | BMBL |
Bumble Inc.
Class A Common Stock |
S - Sale | -109,274 | 1,311,478 | -7.69 | 11.10 | -1,212,592 | 14,553,209 | |
| 2023-12-05 |
|
4 | BMBL |
Bumble Inc.
Class A Common Stock |
S - Sale | -1,706 | 13,869 | -10.95 | 13.88 | -23,680 | 192,511 | |
| 2023-12-05 |
|
4 | BMBL |
Bumble Inc.
Class A Common Stock |
S - Sale | -1,041,402 | 8,468,432 | -10.95 | 13.88 | -14,455,389 | 117,547,764 | |
| 2023-12-05 |
|
4 | BMBL |
Bumble Inc.
Class A Common Stock |
S - Sale | -390,270 | 3,173,580 | -10.95 | 13.88 | -5,417,221 | 44,051,512 | |
| 2023-12-05 |
|
4 | BMBL |
Bumble Inc.
Class A Common Stock |
S - Sale | -2,404,006 | 19,548,793 | -10.95 | 13.88 | -33,369,286 | 271,350,931 | |
| 2023-12-05 |
|
4 | BMBL |
Bumble Inc.
Class A Common Stock |
S - Sale | -174,717 | 1,420,752 | -10.95 | 13.88 | -2,425,194 | 19,721,032 | |
| 2023-11-16 |
|
4 | HG |
Hamilton Insurance Group, Ltd.
Class B Common Stock |
S - Sale | -53,182 | 0 | -100.00 | 14.06 | -747,872 | ||
| 2023-11-16 |
|
4 | HG |
Hamilton Insurance Group, Ltd.
Class B Common Stock |
S - Sale | -918,789 | 0 | -100.00 | 14.06 | -12,920,470 | ||
| 2023-11-14 |
|
4 | FOA |
Finance of America Companies Inc.
Class A Common Stock |
J - Other | -5,965 | 24,349,925 | -0.02 | ||||
| 2023-11-14 |
|
4 | FOA |
Finance of America Companies Inc.
Class A Common Stock |
J - Other | -78 | 43,228 | -0.18 | ||||
| 2023-11-14 |
|
4 | FOA |
Finance of America Companies Inc.
Class A Common Stock |
C - Conversion | 78 | 43,306 | 0.18 | ||||
| 2023-11-14 |
|
4 | FOA |
Finance of America Companies Inc.
Class A Common Stock |
J - Other | -13,628 | 7,717,103 | -0.18 | ||||
| 2023-11-14 |
|
4 | FOA |
Finance of America Companies Inc.
Class A Common Stock |
C - Conversion | 13,628 | 7,730,731 | 0.18 | ||||
| 2023-11-09 | 3 | HG |
Hamilton Insurance Group, Ltd.
Class B Common Stock |
918,789 | ||||||||
| 2023-11-09 | 3 | HG |
Hamilton Insurance Group, Ltd.
Class B Common Stock |
53,182 | ||||||||
| 2023-08-22 |
|
4 | ALIT |
Alight, Inc. / Delaware
Class A common stock |
S - Sale | -388,049 | 43,602 | -89.90 | 7.98 | -3,096,631 | 347,944 | |
| 2023-08-22 |
|
4 | ALIT |
Alight, Inc. / Delaware
Class A common stock |
S - Sale | -387,714 | 23,865,454 | -1.60 | 7.98 | -3,093,958 | 190,446,323 | |
| 2023-08-22 |
|
4 | ALIT |
Alight, Inc. / Delaware
Class A common stock |
S - Sale | -6,967,419 | 431,651 | -94.17 | 7.98 | -55,600,004 | 3,444,575 | |
| 2023-08-22 |
|
4 | ALIT |
Alight, Inc. / Delaware
Class A common stock |
C - Conversion | 7,342,042 | 7,399,070 | 12,874.45 | ||||
| 2023-08-22 |
|
4 | ALIT |
Alight, Inc. / Delaware
Class V common stock |
J - Other | -7,342,042 | 23,842,419 | -23.54 | ||||
| 2023-08-22 |
|
4 | ALIT |
Alight, Inc. / Delaware
Class A common stock |
S - Sale | -6,961,421 | 24,253,168 | -22.30 | 7.98 | -55,552,140 | 193,540,281 | |
| 2023-08-16 |
|
4 | APG |
APi Group Corp
Common Stock |
S - Sale | -32,004 | 0 | -100.00 | 27.80 | -889,711 | ||
| 2023-08-16 |
|
4 | APG |
APi Group Corp
Common Stock |
S - Sale | -2,566,605 | 0 | -100.00 | 27.80 | -71,351,619 | ||
| 2023-08-14 |
|
4 | FOA |
Finance of America Companies Inc.
Class A Common Stock |
J - Other | -30,820 | 24,355,890 | -0.13 | ||||
| 2023-08-14 |
|
4 | FOA |
Finance of America Companies Inc.
Class A Common Stock |
J - Other | -404 | 43,228 | -0.93 | ||||
| 2023-08-14 |
|
4 | FOA |
Finance of America Companies Inc.
Class A Common Stock |
C - Conversion | 404 | 43,632 | 0.93 | ||||
| 2023-08-14 |
|
4 | FOA |
Finance of America Companies Inc.
Class A Common Stock |
J - Other | -70,412 | 7,717,103 | -0.90 | ||||
| 2023-08-14 |
|
4 | FOA |
Finance of America Companies Inc.
Class A Common Stock |
C - Conversion | 70,412 | 7,787,515 | 0.91 | ||||
| 2023-06-16 |
|
4 | AMPS |
Altus Power, Inc.
Class A Common Stock |
P - Purchase | 45,000 | 21,116,125 | 0.21 | 5.47 | 246,177 | 115,517,873 | |
| 2023-06-12 |
|
4 | AMPS |
Altus Power, Inc.
Class A Common Stock |
P - Purchase | 57,000 | 21,071,125 | 0.27 | 5.25 | 299,301 | 110,642,370 | |
| 2023-06-08 |
|
4 | AMPS |
Altus Power, Inc.
Class A Common Stock |
P - Purchase | 224,000 | 21,014,125 | 1.08 | 5.53 | 1,237,869 | 116,128,258 | |
| 2023-06-08 |
|
4 | AMPS |
Altus Power, Inc.
Class A Common Stock |
P - Purchase | 15,000 | 20,790,125 | 0.07 | 5.17 | 77,548 | 107,482,867 | |
| 2023-04-04 |
|
4 | FOA |
Finance of America Companies Inc.
Class A Common Stock |
J - Other | -340,506 | 24,386,710 | -1.38 | ||||
| 2023-04-04 |
|
4 | FOA |
Finance of America Companies Inc.
Class A Common Stock |
J - Other | -4,466 | 43,228 | -9.36 | ||||
| 2023-04-04 |
|
4 | FOA |
Finance of America Companies Inc.
Class A Common Stock |
C - Conversion | 4,466 | 47,694 | 10.33 | ||||
| 2023-04-04 |
|
4 | FOA |
Finance of America Companies Inc.
Class A Common Stock |
J - Other | -777,935 | 7,717,103 | -9.16 | ||||
| 2023-04-04 |
|
4 | FOA |
Finance of America Companies Inc.
Class A Common Stock |
C - Conversion | 777,935 | 8,495,038 | 10.08 | ||||
| 2023-04-04 |
|
4 | FOA |
Finance of America Companies Inc.
Class A Common Stock |
P - Purchase | 43,228 | 43,228 | 1.38 | 59,655 | 59,655 | ||
| 2023-04-04 |
|
4 | FOA |
Finance of America Companies Inc.
Class A Common Stock |
P - Purchase | 3,109,235 | 24,727,216 | 14.38 | 1.38 | 4,290,744 | 34,123,558 | |
| 2023-04-04 |
|
4 | FOA |
Finance of America Companies Inc.
Class A Common Stock |
P - Purchase | 7,717,103 | 7,717,103 | 1.38 | 10,649,602 | 10,649,602 | ||
| 2023-03-08 |
|
4 | BMBL |
Bumble Inc.
Class A Common Stock |
S - Sale | -10,149 | 0 | -100.00 | 22.17 | -225,034 | ||
| 2023-03-08 |
|
4 | BMBL |
Bumble Inc.
Class A Common Stock |
C - Conversion | 10,149 | 10,149 | |||||
| 2023-03-08 |
|
4 | BMBL |
Bumble Inc.
Class A Common Stock |
S - Sale | -46,472 | 0 | -100.00 | 22.17 | -1,030,424 | ||
| 2023-03-08 |
|
4 | BMBL |
Bumble Inc.
Class A Common Stock |
C - Conversion | 46,472 | 46,472 | |||||
| 2023-03-08 |
|
4 | BMBL |
Bumble Inc.
Class A Common Stock |
S - Sale | -5,152,496 | 15,575 | -99.70 | 22.17 | -114,246,294 | 345,344 | |
| 2023-03-08 |
|
4 | BMBL |
Bumble Inc.
Class A Common Stock |
C - Conversion | 5,149,714 | 5,168,071 | 28,053.14 | ||||
| 2023-03-08 |
|
4 | BMBL |
Bumble Inc.
Class A Common Stock |
S - Sale | -1,698,508 | 9,509,834 | -15.15 | 22.17 | -37,661,018 | 210,861,549 | |
| 2023-03-08 |
|
4 | BMBL |
Bumble Inc.
Class A Common Stock |
S - Sale | -636,523 | 3,563,850 | -15.15 | 22.17 | -14,113,624 | 79,021,246 | |
| 2023-03-08 |
|
4 | BMBL |
Bumble Inc.
Class A Common Stock |
S - Sale | -3,920,892 | 21,952,799 | -15.15 | 22.17 | -86,937,938 | 486,759,412 | |
| 2023-03-08 |
|
4 | BMBL |
Bumble Inc.
Class A Common Stock |
S - Sale | -284,960 | 1,595,469 | -15.15 | 22.17 | -6,318,418 | 35,376,334 | |
| 2023-03-06 |
|
4 | ALIT |
Alight, Inc. / Delaware
Class A common stock |
S - Sale | -303,584 | 57,028 | -84.19 | 8.71 | -2,644,217 | 496,714 | |
| 2023-03-06 |
|
4 | ALIT |
Alight, Inc. / Delaware
Class A common stock |
S - Sale | -303,323 | 31,214,589 | -0.96 | 8.71 | -2,641,943 | 271,879,070 | |
| 2023-03-06 |
|
4 | ALIT |
Alight, Inc. / Delaware
Class A common stock |
S - Sale | -13,983,894 | 360,612 | -97.49 | 8.71 | -121,799,717 | 3,140,931 | |
| 2023-03-06 |
|
4 | ALIT |
Alight, Inc. / Delaware
Class A common stock |
C - Conversion | 14,261,397 | 14,344,506 | 17,159.87 | ||||
| 2023-03-06 |
|
4 | ALIT |
Alight, Inc. / Delaware
Class V common stock |
J - Other | -14,261,397 | 31,184,461 | -31.38 | ||||
| 2023-03-06 |
|
4 | ALIT |
Alight, Inc. / Delaware
Class A common stock |
S - Sale | -13,971,851 | 31,517,912 | -30.71 | 8.71 | -121,694,822 | 274,521,014 | |
| 2023-01-24 | 3 | BAER |
Wildfire New PubCo, Inc.
Common Stock |
9,389,895 | ||||||||
| 2023-01-24 | 3 | BAER |
Wildfire New PubCo, Inc.
Common Stock |
162,194 | ||||||||
| 2023-01-24 | 3 | BAER |
Wildfire New PubCo, Inc.
Common Stock |
72,521 | ||||||||
| 2023-01-17 |
|
4 | FOA |
Finance of America Companies Inc.
Class A Common Stock |
J - Other | -98,424 | 21,617,981 | -0.45 | ||||
| 2023-01-17 |
|
4 | FOA |
Finance of America Companies Inc.
Class A Common Stock |
J - Other | -1,291 | 0 | -100.00 | ||||
| 2023-01-17 |
|
4 | FOA |
Finance of America Companies Inc.
Class A Common Stock |
C - Conversion | 1,291 | 1,291 | |||||
| 2023-01-17 |
|
4 | FOA |
Finance of America Companies Inc.
Class A Common Stock |
J - Other | -224,864 | 0 | -100.00 | ||||
| 2023-01-17 |
|
4 | FOA |
Finance of America Companies Inc.
Class A Common Stock |
C - Conversion | 224,864 | 224,864 | |||||
| 2022-12-16 |
|
4 | ALIT |
Alight, Inc. / Delaware
Class A common stock |
S - Sale | -3,172,150 | 83,109 | -97.45 | 8.00 | -25,377,200 | 664,872 | |
| 2022-12-16 |
|
4 | ALIT |
Alight, Inc. / Delaware
Class A common stock |
C - Conversion | 3,166,358 | 3,255,259 | 3,561.67 | ||||
| 2022-12-16 |
|
4 | ALIT |
Alight, Inc. / Delaware
Class V common stock |
J - Other | -3,166,358 | 45,445,858 | -6.51 | ||||
| 2022-12-16 |
|
4 | ALIT |
Alight, Inc. / Delaware
Class A common stock |
S - Sale | -3,169,418 | 45,489,763 | -6.51 | 8.00 | -25,355,344 | 363,918,104 | |
| 2022-11-17 |
|
4 | ALIT |
Alight, Inc. / Delaware
Class V Common Stock |
J - Other | -619,388 | 4,961,364 | -11.10 | ||||
| 2022-11-17 |
|
4 | ALIT |
Alight, Inc. / Delaware
Class V Common Stock |
J - Other | -58,078 | 465,213 | -11.10 | ||||
| 2022-11-17 |
|
4 | ALIT |
Alight, Inc. / Delaware
Class V Common Stock |
J - Other | -20,152 | 161,420 | -11.10 | ||||
| 2022-11-17 |
|
4 | ALIT |
Alight, Inc. / Delaware
Class V Common Stock |
J - Other | -5,371,237 | 43,024,219 | -11.10 | ||||
| 2022-11-17 |
|
4 | ALIT |
Alight, Inc. / Delaware
Class A Common Stock |
S - Sale | -6,074,717 | 48,659,181 | -11.10 | 7.46 | -45,317,389 | 362,997,490 | |
| 2022-11-17 |
|
4 | ALIT |
Alight, Inc. / Delaware
Class A Common Stock |
S - Sale | -620,521 | 9,073 | -98.56 | 7.46 | -4,629,087 | 67,685 | |
| 2022-11-17 |
|
4 | ALIT |
Alight, Inc. / Delaware
Class A Common Stock |
S - Sale | -58,184 | 851 | -98.56 | 7.46 | -434,053 | 6,348 | |
| 2022-11-17 |
|
4 | ALIT |
Alight, Inc. / Delaware
Class A Common Stock |
S - Sale | -20,189 | 295 | -98.56 | 7.46 | -150,610 | 2,201 | |
| 2022-11-17 |
|
4 | ALIT |
Alight, Inc. / Delaware
Class A Common Stock |
S - Sale | -5,381,060 | 78,682 | -98.56 | 7.46 | -40,142,708 | 586,968 | |
| 2022-11-17 |
|
4 | ALIT |
Alight, Inc. / Delaware
Class A Common Stock |
C - Conversion | 619,388 | 629,594 | 6,068.86 | ||||
| 2022-11-17 |
|
4 | ALIT |
Alight, Inc. / Delaware
Class A Common Stock |
C - Conversion | 58,078 | 59,035 | 6,068.76 | ||||
| 2022-11-17 |
|
4 | ALIT |
Alight, Inc. / Delaware
Class A Common Stock |
C - Conversion | 20,152 | 20,484 | 6,069.88 | ||||
| 2022-11-17 |
|
4 | ALIT |
Alight, Inc. / Delaware
Class A Common Stock |
C - Conversion | 5,371,237 | 5,459,742 | 6,068.85 | ||||
| 2022-11-14 | 3 | APG |
APi Group Corp
Common Stock |
1,440,739 | ||||||||
| 2022-11-14 | 3 | APG |
APi Group Corp
Common Stock |
17,966 | ||||||||
| 2022-10-12 |
|
4 | AMPS |
Altus Power, Inc.
Class A Common Stock |
S - Sale | -1,050,000 | 20,775,125 | -4.81 | 11.01 | -11,560,500 | 228,734,126 | |
| 2022-10-03 |
|
4 | AMPS |
Altus Power, Inc.
Class A Common Stock |
S - Sale | -7,000,000 | 21,825,125 | -24.28 | 11.01 | -77,070,000 | 240,294,626 | |
| 2022-08-10 |
|
4 | FOA |
Finance of America Companies Inc.
Class A Common Stock |
J - Other | -97,429 | 21,716,405 | -0.45 | ||||
| 2022-08-10 |
|
4 | FOA |
Finance of America Companies Inc.
Class A Common Stock |
J - Other | -1,278 | 0 | -100.00 | ||||
| 2022-08-10 |
|
4 | FOA |
Finance of America Companies Inc.
Class A Common Stock |
C - Conversion | 1,278 | 1,278 | |||||
| 2022-08-10 |
|
4 | FOA |
Finance of America Companies Inc.
Class A Common Stock |
J - Other | -222,591 | 0 | -100.00 | ||||
| 2022-08-10 |
|
4 | FOA |
Finance of America Companies Inc.
Class A Common Stock |
C - Conversion | 222,591 | 222,591 | |||||
| 2022-05-03 |
|
4 | SMFR |
Sema4 Holdings Corp.
Class A Common Stock |
P - Purchase | 14,735 | 162,309 | 9.98 | 4.00 | 58,940 | 649,236 | |
| 2022-05-03 |
|
4 | SMFR |
Sema4 Holdings Corp.
Class A Common Stock |
P - Purchase | 50,402 | 555,497 | 9.98 | 4.00 | 201,608 | 2,221,988 | |
| 2022-05-03 |
|
4 | SMFR |
Sema4 Holdings Corp.
Class A Common Stock |
P - Purchase | 2,434,863 | 26,839,187 | 9.98 | 4.00 | 9,739,452 | 107,356,748 | |
| 2022-04-05 |
|
4 | FOA |
Finance of America Companies Inc.
LLC Units of Finance of America Equity Capital LLC |
C - Conversion | -4,816 | 286,090 | -1.66 | ||||
| 2022-04-05 |
|
4 | FOA |
Finance of America Companies Inc.
LLC Units of Finance of America Equity Capital LLC |
C - Conversion | -839,115 | 49,836,805 | -1.66 | ||||
| 2022-04-05 |
|
4 | FOA |
Finance of America Companies Inc.
Class A Common Stock |
J - Other | -639,752 | 21,813,834 | -2.85 | ||||
| 2022-04-05 |
|
4 | FOA |
Finance of America Companies Inc.
Class A Common Stock |
J - Other | -8,390 | 0 | -100.00 | ||||
| 2022-04-05 |
|
4 | FOA |
Finance of America Companies Inc.
Class A Common Stock |
C - Conversion | 4,816 | 8,390 | 134.75 | ||||
| 2022-04-05 |
|
4 | FOA |
Finance of America Companies Inc.
Class A Common Stock |
J - Other | -1,461,604 | 0 | -100.00 | ||||
| 2022-04-05 |
|
4 | FOA |
Finance of America Companies Inc.
Class A Common Stock |
C - Conversion | 839,115 | 1,461,604 | 134.80 | ||||
| 2022-04-01 |
|
4 | IMGO |
Imago BioSciences, Inc.
Common Stock |
J - Other | -1,000,000 | 2,375,037 | -29.63 | ||||
| 2022-03-08 |
|
4 | FOA |
Finance of America Companies Inc.
Class A Common Stock |
J - Other | -2,983 | 22,453,586 | -0.01 | ||||
| 2022-03-08 |
|
4 | FOA |
Finance of America Companies Inc.
Class A Common Stock |
J - Other | -39 | 3,574 | -1.08 | ||||
| 2022-03-08 |
|
4 | FOA |
Finance of America Companies Inc.
Class A Common Stock |
J - Other | -6,814 | 622,489 | -1.08 | ||||
| 2022-03-07 |
|
4 | CPLG |
CorePoint Lodging Inc.
Common Stock |
S - Sale | -444,298 | 0 | -100.00 | 15.99 | -7,104,325 | ||
| 2022-03-07 |
|
4 | CPLG |
CorePoint Lodging Inc.
Common Stock |
S - Sale | -88,291 | 0 | -100.00 | 15.99 | -1,411,773 | ||
| 2022-03-07 |
|
4 | CPLG |
CorePoint Lodging Inc.
Common Stock |
S - Sale | -2,817,965 | 0 | -100.00 | 15.99 | -45,059,260 | ||
| 2022-03-07 |
|
4 | CPLG |
CorePoint Lodging Inc.
Common Stock |
S - Sale | -1,096,835 | 0 | -100.00 | 15.99 | -17,538,392 | ||
| 2022-03-07 |
|
4 | CPLG |
CorePoint Lodging Inc.
Common Stock |
S - Sale | -770,527 | 0 | -100.00 | 15.99 | -12,320,727 | ||
| 2022-03-07 |
|
4 | CPLG |
CorePoint Lodging Inc.
Common Stock |
S - Sale | -3,045,672 | 0 | -100.00 | 15.99 | -48,700,295 | ||
| 2022-03-07 |
|
4 | CPLG |
CorePoint Lodging Inc.
Common Stock |
S - Sale | -89,162 | 0 | -100.00 | 15.99 | -1,425,700 | ||
| 2022-03-07 |
|
4 | CPLG |
CorePoint Lodging Inc.
Common Stock |
S - Sale | -304,078 | 0 | -100.00 | 15.99 | -4,862,207 | ||
| 2022-03-07 |
|
4 | CPLG |
CorePoint Lodging Inc.
Common Stock |
S - Sale | -262,018 | 0 | -100.00 | 15.99 | -4,189,668 | ||
| 2022-03-07 |
|
4 | CPLG |
CorePoint Lodging Inc.
Common Stock |
S - Sale | -190,751 | 0 | -100.00 | 15.99 | -3,050,108 | ||
| 2022-03-07 |
|
4 | CPLG |
CorePoint Lodging Inc.
Common Stock |
S - Sale | -71,631 | 0 | -100.00 | 15.99 | -1,145,380 | ||
| 2022-03-07 |
|
4 | CPLG |
CorePoint Lodging Inc.
Common Stock |
S - Sale | -177,047 | 0 | -100.00 | 15.99 | -2,830,982 | ||
| 2022-03-07 |
|
4 | CPLG |
CorePoint Lodging Inc.
Common Stock |
S - Sale | -526,436 | 0 | -100.00 | 15.99 | -8,417,712 | ||
| 2022-03-07 |
|
4 | CPLG |
CorePoint Lodging Inc.
Common Stock |
S - Sale | -932,172 | 0 | -100.00 | 15.99 | -14,905,430 | ||
| 2022-03-07 |
|
4 | CPLG |
CorePoint Lodging Inc.
Common Stock |
S - Sale | -6,769,655 | 0 | -100.00 | 15.99 | -108,246,783 | ||
| 2022-02-18 |
|
4 | CTOS |
Custom Truck One Source, Inc.
Common Stock |
S - Sale | -2,264 | 0 | -100.00 | 8.07 | -18,270 | ||
| 2022-02-18 |
|
4 | CTOS |
Custom Truck One Source, Inc.
Common Stock |
S - Sale | -466,472 | 0 | -100.00 | 8.07 | -3,764,429 | ||
| 2022-02-18 |
|
4 | CTOS |
Custom Truck One Source, Inc.
Common Stock |
S - Sale | -455,487 | 0 | -100.00 | 8.07 | -3,675,780 | ||
| 2022-02-18 |
|
4 | CTOS |
Custom Truck One Source, Inc.
Common Stock |
S - Sale | -23,457 | 0 | -100.00 | 8.07 | -189,298 | ||
| 2022-02-18 |
|
4 | CTOS |
Custom Truck One Source, Inc.
Common Stock |
S - Sale | -45,860 | 0 | -100.00 | 8.07 | -370,090 | ||
| 2022-02-18 |
|
4 | CTOS |
Custom Truck One Source, Inc.
Common Stock |
S - Sale | -472,446 | 0 | -100.00 | 8.07 | -3,812,639 | ||
| 2022-02-18 |
|
4 | CTOS |
Custom Truck One Source, Inc.
Common Stock |
S - Sale | -382,460 | 0 | -100.00 | 8.07 | -3,086,452 | ||
| 2021-12-17 | 3 | AMPS |
Altus Power, Inc.
Class A Common Stock |
28,825,125 | ||||||||
| 2021-11-22 |
|
4 | CTOS |
Custom Truck One Source, Inc.
Common Stock |
S - Sale | -15,096 | 2,264 | -86.96 | 8.20 | -123,825 | 18,570 | |
| 2021-11-22 |
|
4 | CTOS |
Custom Truck One Source, Inc.
Common Stock |
S - Sale | -3,109,809 | 466,472 | -86.96 | 8.20 | -25,508,208 | 3,826,237 | |
| 2021-11-22 |
|
4 | CTOS |
Custom Truck One Source, Inc.
Common Stock |
S - Sale | -3,036,582 | 455,487 | -86.96 | 8.20 | -24,907,564 | 3,736,132 | |
| 2021-11-22 |
|
4 | CTOS |
Custom Truck One Source, Inc.
Common Stock |
S - Sale | -156,378 | 23,457 | -86.96 | 8.20 | -1,282,691 | 192,406 | |
| 2021-11-22 |
|
4 | CTOS |
Custom Truck One Source, Inc.
Common Stock |
S - Sale | -305,733 | 45,860 | -86.96 | 8.20 | -2,507,775 | 376,167 | |
| 2021-11-22 |
|
4 | CTOS |
Custom Truck One Source, Inc.
Common Stock |
S - Sale | -3,149,642 | 472,446 | -86.96 | 8.20 | -25,834,939 | 3,875,238 | |
| 2021-11-22 |
|
4 | CTOS |
Custom Truck One Source, Inc.
Common Stock |
S - Sale | -2,549,735 | 382,460 | -86.96 | 8.20 | -20,914,201 | 3,137,128 | |
| 2021-11-18 |
|
4 | CYRX |
Cryoport, Inc.
Common Stock |
S - Sale | -11,400 | 10,339 | -52.44 | 76.00 | -866,400 | 785,764 | |
| 2021-11-18 |
|
4 | CYRX |
Cryoport, Inc.
Common Stock |
S - Sale | -488,600 | 443,057 | -52.44 | 76.00 | -37,133,600 | 33,672,332 | |
| 2021-10-08 |
|
4 | PRAX |
Praxis Precision Medicines, Inc.
Common Stock |
S - Sale | -400,000 | 0 | -100.00 | 17.50 | -7,000,000 | ||
| 2021-10-05 |
|
4 | PRAX |
Praxis Precision Medicines, Inc.
Common Stock |
S - Sale | -23,946 | 400,000 | -5.65 | 19.15 | -458,566 | 7,660,000 | |
| 2021-10-05 |
|
4 | PRAX |
Praxis Precision Medicines, Inc.
Common Stock |
S - Sale | -22,600 | 423,946 | -5.06 | 19.13 | -432,338 | 8,110,087 | |
| 2021-10-01 |
|
4 | FOA |
Finance of America Companies Inc.
Class A Common Stock |
J - Other | -609,926 | 22,456,569 | -2.64 | ||||
| 2021-10-01 |
|
4 | FOA |
Finance of America Companies Inc.
Class A Common Stock |
J - Other | -7,999 | 3,613 | -68.89 | ||||
| 2021-10-01 |
|
4 | FOA |
Finance of America Companies Inc.
Class A Common Stock |
J - Other | -1,393,463 | 629,303 | -68.89 | ||||
| 2021-09-15 |
|
4 | BMBL |
Bumble Inc.
Common Units of Buzz Holdings L.P. |
C - Conversion | -17,879 | 66,969 | -21.07 | ||||
| 2021-09-15 |
|
4 | BMBL |
Bumble Inc.
Common Units of Buzz Holdings L.P. |
C - Conversion | -81,871 | 306,667 | -21.07 | ||||
| 2021-09-15 |
|
4 | BMBL |
Bumble Inc.
Common Units of Buzz Holdings L.P. |
C - Conversion | -9,072,260 | 33,982,606 | -21.07 | ||||
| 2021-09-15 |
|
4 | BMBL |
Bumble Inc.
Class A Common Stock |
S - Sale | -17,879 | 0 | -100.00 | 52.38 | -936,502 | ||
| 2021-09-15 |
|
4 | BMBL |
Bumble Inc.
Class A Common Stock |
C - Conversion | 17,879 | 17,879 | |||||
| 2021-09-15 |
|
4 | BMBL |
Bumble Inc.
Class A Common Stock |
S - Sale | -81,871 | 0 | -100.00 | 52.38 | -4,288,403 | ||
| 2021-09-15 |
|
4 | BMBL |
Bumble Inc.
Class A Common Stock |
C - Conversion | 81,871 | 81,871 | |||||
| 2021-09-15 |
|
4 | BMBL |
Bumble Inc.
Class A Common Stock |
S - Sale | -9,077,161 | 18,357 | -99.80 | 52.38 | -475,461,693 | 961,540 | |
| 2021-09-15 |
|
4 | BMBL |
Bumble Inc.
Class A Common Stock |
C - Conversion | 9,072,260 | 9,095,518 | 39,007.05 | ||||
| 2021-09-15 |
|
4 | BMBL |
Bumble Inc.
Class A Common Stock |
S - Sale | -2,992,267 | 11,208,342 | -21.07 | 52.38 | -156,734,945 | 587,092,954 | |
| 2021-09-15 |
|
4 | BMBL |
Bumble Inc.
Class A Common Stock |
S - Sale | -1,121,365 | 4,200,373 | -21.07 | 52.38 | -58,737,099 | 220,015,538 | |
| 2021-09-15 |
|
4 | BMBL |
Bumble Inc.
Class A Common Stock |
S - Sale | -6,907,443 | 25,873,691 | -21.07 | 52.38 | -361,811,864 | 1,355,263,935 | |
| 2021-09-15 |
|
4 | BMBL |
Bumble Inc.
Class A Common Stock |
S - Sale | -502,014 | 1,880,429 | -21.07 | 52.38 | -26,295,493 | 98,496,871 | |
| 2021-08-30 | 3 | SMFR |
Sema4 Holdings Corp.
Class A Common Stock |
24,404,324 | ||||||||
| 2021-08-30 | 3 | SMFR |
Sema4 Holdings Corp.
Class A Common Stock |
505,095 | ||||||||
| 2021-08-30 | 3 | SMFR |
Sema4 Holdings Corp.
Class A Common Stock |
147,574 | ||||||||
| 2021-08-30 | 3 | SMFR |
Sema4 Holdings Corp.
Class A Common Stock |
100,000 | ||||||||
| 2021-08-26 |
|
4 | CYRX |
Cryoport, Inc.
Common Stock |
S - Sale | -7,638 | 21,739 | -26.00 | 60.00 | -458,280 | 1,304,340 | |
| 2021-08-26 |
|
4 | CYRX |
Cryoport, Inc.
Common Stock |
S - Sale | -327,362 | 931,657 | -26.00 | 60.00 | -19,641,720 | 55,899,420 | |
| 2021-08-25 |
|
4 | PRAX |
Praxis Precision Medicines, Inc.
Common Stock |
S - Sale | -771 | 446,546 | -0.17 | 20.04 | -15,451 | 8,948,782 | |
| 2021-08-25 |
|
4 | PRAX |
Praxis Precision Medicines, Inc.
Common Stock |
S - Sale | -351,625 | 447,317 | -44.01 | 19.00 | -6,680,875 | 8,499,023 | |
| 2021-08-20 |
|
4 | PRAX |
Praxis Precision Medicines, Inc.
Common Stock |
S - Sale | -3,000 | 798,942 | -0.37 | 15.88 | -47,640 | 12,687,199 | |
| 2021-08-13 |
|
4 | PRAX |
Praxis Precision Medicines, Inc.
Common Stock |
S - Sale | -10,060 | 801,942 | -1.24 | 13.92 | -140,035 | 11,163,033 | |
| 2021-08-13 |
|
4 | PRAX |
Praxis Precision Medicines, Inc.
Common Stock |
S - Sale | -17,222 | 812,002 | -2.08 | 15.03 | -258,847 | 12,204,390 | |
| 2021-08-05 |
|
4 | PRAX |
Praxis Precision Medicines, Inc.
Common Stock |
S - Sale | -22,300 | 829,224 | -2.62 | 14.99 | -334,277 | 12,430,068 | |
| 2021-08-03 |
|
4 | PRAX |
Praxis Precision Medicines, Inc.
Common Stock |
S - Sale | -40,000 | 851,524 | -4.49 | 15.78 | -631,200 | 13,437,049 | |
| 2021-08-03 |
|
4 | PRAX |
Praxis Precision Medicines, Inc.
Common Stock |
S - Sale | -15,854 | 891,524 | -1.75 | 15.68 | -248,591 | 13,979,096 | |
| 2021-07-20 |
|
4 | IMGO |
Imago BioSciences, Inc.
Series C convertible Preferred Stock |
C - Conversion | -197,131 | 0 | -100.00 | ||||
| 2021-07-20 |
|
4 | IMGO |
Imago BioSciences, Inc.
Series B convertible Preferred Stock |
C - Conversion | -1,155,689 | 0 | -100.00 | ||||
| 2021-07-20 |
|
4 | IMGO |
Imago BioSciences, Inc.
Series A convertible Preferred Stock |
C - Conversion | -1,872,217 | 0 | -100.00 | ||||
| 2021-07-20 |
|
4 | IMGO |
Imago BioSciences, Inc.
Common Stock |
P - Purchase | 150,000 | 3,375,037 | 4.65 | 16.00 | 2,400,000 | 54,000,592 | |
| 2021-07-20 |
|
4 | IMGO |
Imago BioSciences, Inc.
Common Stock |
C - Conversion | 197,131 | 3,225,037 | 6.51 | ||||
| 2021-07-20 |
|
4 | IMGO |
Imago BioSciences, Inc.
Common Stock |
C - Conversion | 1,155,689 | 3,027,906 | 61.73 | ||||
| 2021-07-20 |
|
4 | IMGO |
Imago BioSciences, Inc.
Common Stock |
C - Conversion | 1,872,217 | 1,872,217 | |||||
| 2021-07-12 | 3 | ALIT |
Alight Group, Inc.
Class A common stock |
88,505 | ||||||||
| 2021-07-12 | 3 | ALIT |
Alight Group, Inc.
Class A common stock |
332 | ||||||||
| 2021-07-12 | 3 | ALIT |
Alight Group, Inc.
Class A common stock |
957 | ||||||||
| 2021-07-12 | 3 | ALIT |
Alight Group, Inc.
Class A common stock |
10,206 | ||||||||
| 2021-07-12 | 3 | ALIT |
Alight Group, Inc.
Class A common stock |
54,733,898 | ||||||||
| 2021-07-12 | 3 | ALIT |
Alight Group, Inc.
Class V common stock |
48,395,456 | ||||||||
| 2021-07-12 | 3 | ALIT |
Alight Group, Inc.
Class V common stock |
181,572 | ||||||||
| 2021-07-12 | 3 | ALIT |
Alight Group, Inc.
Class V common stock |
523,291 | ||||||||
| 2021-07-12 | 3 | ALIT |
Alight Group, Inc.
Class V common stock |
5,580,752 | ||||||||
| 2021-06-17 |
|
4 | CYRX |
Cryoport, Inc.
Common Stock |
S - Sale | -4,560 | 29,377 | -13.44 | 60.00 | -273,600 | 1,762,620 | |
| 2021-06-17 |
|
4 | CYRX |
Cryoport, Inc.
Common Stock |
S - Sale | -195,440 | 1,259,019 | -13.44 | 60.00 | -11,726,400 | 75,541,140 | |
| 2021-06-11 |
|
4 | CYRX |
Cryoport, Inc.
Common Stock |
S - Sale | -11,401 | 33,937 | -25.15 | 60.00 | -684,060 | 2,036,220 | |
| 2021-06-11 |
|
4 | CYRX |
Cryoport, Inc.
Common Stock |
S - Sale | -488,599 | 1,454,459 | -25.15 | 60.00 | -29,315,940 | 87,267,540 | |
| 2021-05-14 |
|
4 | TALS |
Talaris Therapeutics, Inc.
Series B Convertible Preferred Stock |
C - Conversion | -135,334 | 0 | -100.00 | ||||
| 2021-05-14 |
|
4 | TALS |
Talaris Therapeutics, Inc.
Series B Convertible Preferred Stock |
C - Conversion | -676,774 | 0 | -100.00 | ||||
| 2021-05-14 |
|
4 | TALS |
Talaris Therapeutics, Inc.
Series B Convertible Preferred Stock |
C - Conversion | -366,918 | 0 | -100.00 | ||||
| 2021-05-14 |
|
4 | TALS |
Talaris Therapeutics, Inc.
Series B Convertible Preferred Stock |
C - Conversion | -562,891 | 0 | -100.00 | ||||
| 2021-05-14 |
|
4 | TALS |
Talaris Therapeutics, Inc.
Series B Convertible Preferred Stock |
C - Conversion | -278,707 | 0 | -100.00 | ||||
| 2021-05-14 |
|
4 | TALS |
Talaris Therapeutics, Inc.
Series B Convertible Preferred Stock |
C - Conversion | -696,767 | 0 | -100.00 | ||||
| 2021-05-14 |
|
4 | TALS |
Talaris Therapeutics, Inc.
Series A-1 Convertible Preferred Stock |
C - Conversion | -717,160 | 0 | -100.00 | ||||
| 2021-05-14 |
|
4 | TALS |
Talaris Therapeutics, Inc.
Series A-1 Convertible Preferred Stock |
C - Conversion | -3,586,364 | 0 | -100.00 | ||||
| 2021-05-14 |
|
4 | TALS |
Talaris Therapeutics, Inc.
Series A-1 Convertible Preferred Stock |
C - Conversion | -1,944,371 | 0 | -100.00 | ||||
| 2021-05-14 |
|
4 | TALS |
Talaris Therapeutics, Inc.
Series A-1 Convertible Preferred Stock |
C - Conversion | -2,982,874 | 0 | -100.00 | ||||
| 2021-05-14 |
|
4 | TALS |
Talaris Therapeutics, Inc.
Series A-1 Convertible Preferred Stock |
C - Conversion | -1,476,924 | 0 | -100.00 | ||||
| 2021-05-14 |
|
4 | TALS |
Talaris Therapeutics, Inc.
Series A-1 Convertible Preferred Stock |
C - Conversion | -3,692,307 | 0 | -100.00 | ||||
| 2021-05-14 |
|
4 | TALS |
Talaris Therapeutics, Inc.
Series A Convertible Preferred Stock |
C - Conversion | -26,000,000 | 0 | -100.00 | ||||
| 2021-05-14 |
|
4 | TALS |
Talaris Therapeutics, Inc.
Common Stock |
P - Purchase | 701 | 160,044 | 0.44 | 17.00 | 11,917 | 2,720,748 | |
| 2021-05-14 |
|
4 | TALS |
Talaris Therapeutics, Inc.
Common Stock |
P - Purchase | 3,507 | 800,353 | 0.44 | 17.00 | 59,619 | 13,606,001 | |
| 2021-05-14 |
|
4 | TALS |
Talaris Therapeutics, Inc.
Common Stock |
P - Purchase | 1,902 | 433,917 | 0.44 | 17.00 | 32,334 | 7,376,589 | |
| 2021-05-14 |
|
4 | TALS |
Talaris Therapeutics, Inc.
Common Stock |
P - Purchase | 2,917 | 665,676 | 0.44 | 17.00 | 49,589 | 11,316,492 | |
| 2021-05-14 |
|
4 | TALS |
Talaris Therapeutics, Inc.
Common Stock |
P - Purchase | 1,444 | 329,598 | 0.44 | 17.00 | 24,548 | 5,603,166 | |
| 2021-05-14 |
|
4 | TALS |
Talaris Therapeutics, Inc.
Common Stock |
P - Purchase | 3,611 | 823,997 | 0.44 | 17.00 | 61,387 | 14,007,949 | |
| 2021-05-14 |
|
4 | TALS |
Talaris Therapeutics, Inc.
Common Stock |
P - Purchase | 15,918 | 4,875,730 | 0.33 | 17.00 | 270,606 | 82,887,410 | |
| 2021-05-14 |
|
4 | TALS |
Talaris Therapeutics, Inc.
Common Stock |
C - Conversion | 25,296 | 159,343 | 18.87 | ||||
| 2021-05-14 |
|
4 | TALS |
Talaris Therapeutics, Inc.
Common Stock |
C - Conversion | 126,499 | 796,846 | 18.87 | ||||
| 2021-05-14 |
|
4 | TALS |
Talaris Therapeutics, Inc.
Common Stock |
C - Conversion | 68,582 | 432,015 | 18.87 | ||||
| 2021-05-14 |
|
4 | TALS |
Talaris Therapeutics, Inc.
Common Stock |
C - Conversion | 105,213 | 662,759 | 18.87 | ||||
| 2021-05-14 |
|
4 | TALS |
Talaris Therapeutics, Inc.
Common Stock |
C - Conversion | 52,094 | 328,154 | 18.87 | ||||
| 2021-05-14 |
|
4 | TALS |
Talaris Therapeutics, Inc.
Common Stock |
C - Conversion | 130,236 | 820,386 | 18.87 | ||||
| 2021-05-14 |
|
4 | TALS |
Talaris Therapeutics, Inc.
Common Stock |
C - Conversion | 134,047 | 134,047 | |||||
| 2021-05-14 |
|
4 | TALS |
Talaris Therapeutics, Inc.
Common Stock |
C - Conversion | 670,347 | 670,347 | |||||
| 2021-05-14 |
|
4 | TALS |
Talaris Therapeutics, Inc.
Common Stock |
C - Conversion | 363,433 | 363,433 | |||||
| 2021-05-14 |
|
4 | TALS |
Talaris Therapeutics, Inc.
Common Stock |
C - Conversion | 557,546 | 557,546 | |||||
| 2021-05-14 |
|
4 | TALS |
Talaris Therapeutics, Inc.
Common Stock |
C - Conversion | 276,060 | 276,060 | |||||
| 2021-05-14 |
|
4 | TALS |
Talaris Therapeutics, Inc.
Common Stock |
C - Conversion | 690,150 | 690,150 | |||||
| 2021-05-14 |
|
4 | TALS |
Talaris Therapeutics, Inc.
Common Stock |
C - Conversion | 4,859,812 | 4,859,812 | |||||
| 2021-04-28 |
|
4/A | BMBL |
Bumble Inc.
Common Units of Buzz Holdings L.P. |
S - Sale | -41,890 | 84,848 | -33.05 | 41.06 | -1,720,213 | 3,484,283 | |
| 2021-04-28 |
|
4/A | BMBL |
Bumble Inc.
Common Units of Buzz Holdings L.P. |
S - Sale | -191,822 | 388,538 | -33.05 | 41.06 | -7,877,170 | 15,955,313 | |
| 2021-04-28 |
|
4/A | BMBL |
Bumble Inc.
Common Units of Buzz Holdings L.P. |
S - Sale | -21,267,747 | 43,054,866 | -33.06 | 41.06 | -873,360,031 | 1,768,048,072 | |
| 2021-04-28 |
|
4/A | BMBL |
Bumble Inc.
Class A Common Stock |
S - Sale | -2,627,352 | 5,321,738 | -33.05 | 41.06 | -107,892,210 | 218,537,171 | |
| 2021-04-28 |
|
4/A | BMBL |
Bumble Inc.
Class A Common Stock |
S - Sale | -1,176,217 | 2,382,443 | -33.05 | 41.06 | -48,301,351 | 97,835,022 | |
| 2021-04-28 |
|
4/A | BMBL |
Bumble Inc.
Class A Common Stock |
S - Sale | -7,010,867 | 14,200,609 | -33.05 | 41.06 | -287,901,253 | 583,148,009 | |
| 2021-04-28 |
|
4/A | BMBL |
Bumble Inc.
Class A Common Stock |
S - Sale | -16,184,106 | 32,781,134 | -33.05 | 41.06 | -664,600,313 | 1,346,157,268 | |
| 2021-04-28 | 3/A | BMBL |
Bumble Inc.
Class A Common Stock |
48,965,240 | ||||||||
| 2021-04-28 | 3/A | BMBL |
Bumble Inc.
Class A Common Stock |
21,211,476 | ||||||||
| 2021-04-28 | 3/A | BMBL |
Bumble Inc.
Class A Common Stock |
3,558,660 | ||||||||
| 2021-04-28 | 3/A | BMBL |
Bumble Inc.
Class A Common Stock |
7,949,090 | ||||||||
| 2021-04-28 | 3/A | BMBL |
Bumble Inc.
Class A Common Stock |
23,258 | ||||||||
| 2021-04-28 | 3/A | BMBL |
Bumble Inc.
Class B Common Stock |
1 | ||||||||
| 2021-04-28 | 3/A | BMBL |
Bumble Inc.
Class B Common Stock |
1 | ||||||||
| 2021-04-28 | 3/A | BMBL |
Bumble Inc.
Class B Common Stock |
1 | ||||||||
| 2021-04-12 | 3 | NSCO |
Custom Truck One Source, Inc.
Common Stock |
2,932,195 | ||||||||
| 2021-04-12 | 3 | NSCO |
Custom Truck One Source, Inc.
Common Stock |
3,622,088 | ||||||||
| 2021-04-12 | 3 | NSCO |
Custom Truck One Source, Inc.
Common Stock |
351,593 | ||||||||
| 2021-04-12 | 3 | NSCO |
Custom Truck One Source, Inc.
Common Stock |
179,835 | ||||||||
| 2021-04-12 | 3 | NSCO |
Custom Truck One Source, Inc.
Common Stock |
3,492,069 | ||||||||
| 2021-04-12 | 3 | NSCO |
Custom Truck One Source, Inc.
Common Stock |
3,576,281 | ||||||||
| 2021-04-12 | 3 | NSCO |
Custom Truck One Source, Inc.
Common Stock |
17,360 | ||||||||
| 2021-04-05 |
|
4 | PACK |
Ranpak Holdings Corp.
Warrant (right to buy) |
P - Purchase | 39,200 | 2,380,800 | 1.67 | 1.31 | 51,368 | 3,119,800 | |
| 2021-04-05 |
|
4 | PACK |
Ranpak Holdings Corp.
Warrant (right to buy) |
S - Sale | -39,200 | 179,200 | -17.95 | 1.31 | -51,368 | 234,824 | |
| 2021-04-05 |
|
4 | PACK |
Ranpak Holdings Corp.
Warrant (right to buy) |
P - Purchase | 140,000 | 2,341,600 | 6.36 | 0.94 | 132,300 | 2,212,812 | |
| 2021-04-05 |
|
4 | PACK |
Ranpak Holdings Corp.
Warrant (right to buy) |
S - Sale | -140,000 | 218,400 | -39.06 | 0.94 | -132,300 | 206,388 | |
| 2021-04-05 |
|
4 | PACK |
Ranpak Holdings Corp.
Class A Common Stock |
P - Purchase | 36,750 | 4,208,250 | 0.88 | 6.82 | 250,484 | 28,683,011 | |
| 2021-04-05 |
|
4 | PACK |
Ranpak Holdings Corp.
Class A Common Stock |
S - Sale | -36,750 | 316,750 | -10.40 | 6.82 | -250,484 | 2,158,936 | |
| 2021-04-05 |
|
4 | PACK |
Ranpak Holdings Corp.
Class A Common Stock |
P - Purchase | 280,000 | 4,171,500 | 7.20 | 7.49 | 2,097,200 | 31,244,535 | |
| 2021-04-05 |
|
4 | PACK |
Ranpak Holdings Corp.
Class A Common Stock |
S - Sale | -280,000 | 353,500 | -44.20 | 7.49 | -2,097,200 | 2,647,715 | |
| 2021-04-05 |
|
4/A | PACK |
Ranpak Holdings Corp.
Warrant (right to buy) |
J - Other | -179,200 | 0 | -100.00 | ||||
| 2021-04-05 |
|
4/A | PACK |
Ranpak Holdings Corp.
Warrant (right to buy) |
J - Other | -2,380,800 | 0 | -100.00 | ||||
| 2021-04-05 |
|
4/A | PACK |
Ranpak Holdings Corp.
Class A Common Stock |
J - Other | 39,424 | 356,174 | 12.45 | ||||
| 2021-04-05 |
|
4/A | PACK |
Ranpak Holdings Corp.
Class A Common Stock |
J - Other | 523,776 | 4,732,026 | 12.45 | ||||
| 2021-04-05 | 3 | FOA |
Finance of America Companies Inc.
Class A Common Stock |
2,022,766 | ||||||||
| 2021-04-05 | 3 | FOA |
Finance of America Companies Inc.
Class A Common Stock |
11,612 | ||||||||
| 2021-04-05 | 3 | FOA |
Finance of America Companies Inc.
Class B Common Stock |
23,066,495 | ||||||||
| 2021-04-05 | 3 | FOA |
Finance of America Companies Inc.
Class B Common Stock |
1 | ||||||||
| 2021-04-05 | 3 | FOA |
Finance of America Companies Inc.
Class B Common Stock |
1 | ||||||||
| 2021-03-26 |
|
4 | CQP |
Cheniere Energy Partners, L.P.
Common Units |
S - Sale | -462,922 | 0 | -100.00 | 37.00 | -17,128,114 | ||
| 2021-03-26 |
|
4 | CQP |
Cheniere Energy Partners, L.P.
Common Units |
S - Sale | -953,855 | 0 | -100.00 | 37.00 | -35,292,635 | ||
| 2021-03-26 |
|
4 | CQP |
Cheniere Energy Partners, L.P.
Common Units |
S - Sale | -953,855 | 0 | -100.00 | 37.00 | -35,292,635 | ||
| 2021-02-18 |
|
4 | BMBL |
Bumble Inc.
Common Units of Buzz Holdings L.P. |
S - Sale | -20,852 | 42,217 | -33.06 | 41.06 | -856,287 | 1,733,641 | |
| 2021-02-18 |
|
4 | BMBL |
Bumble Inc.
Common Units of Buzz Holdings L.P. |
S - Sale | -191,822 | 388,538 | -33.05 | 41.06 | -7,877,170 | 15,955,313 | |
| 2021-02-18 |
|
4 | BMBL |
Bumble Inc.
Common Units of Buzz Holdings L.P. |
S - Sale | -23,488,478 | 47,553,007 | -33.06 | 41.06 | -964,554,349 | 1,952,764,232 | |
| 2021-02-18 |
|
4 | BMBL |
Bumble Inc.
Class A Common Stock |
S - Sale | -2,589,946 | 5,245,973 | -33.05 | 41.06 | -106,356,132 | 215,425,881 | |
| 2021-02-18 |
|
4 | BMBL |
Bumble Inc.
Class A Common Stock |
S - Sale | -1,457,332 | 2,951,847 | -33.05 | 41.06 | -59,845,339 | 121,217,597 | |
| 2021-02-18 |
|
4 | BMBL |
Bumble Inc.
Class A Common Stock |
S - Sale | -6,426,070 | 13,016,095 | -33.05 | 41.06 | -263,886,565 | 534,505,941 | |
| 2021-02-18 |
|
4 | BMBL |
Bumble Inc.
Class A Common Stock |
S - Sale | -14,325,500 | 29,016,501 | -33.05 | 41.06 | -588,276,658 | 1,191,562,614 | |
| 2021-02-12 | 3 | BMBL |
Bumble Inc.
Class A Common Stock |
43,342,001 | ||||||||
| 2021-02-12 | 3 | BMBL |
Bumble Inc.
Class A Common Stock |
19,442,165 | ||||||||
| 2021-02-12 | 3 | BMBL |
Bumble Inc.
Class A Common Stock |
4,409,179 | ||||||||
| 2021-02-12 | 3 | BMBL |
Bumble Inc.
Class A Common Stock |
7,835,919 | ||||||||
| 2021-02-12 | 3 | BMBL |
Bumble Inc.
Class A Common Stock |
23,256 | ||||||||
| 2021-02-12 | 3 | BMBL |
Bumble Inc.
Class B Common Stock |
1 | ||||||||
| 2021-02-12 | 3 | BMBL |
Bumble Inc.
Class B Common Stock |
1 | ||||||||
| 2021-02-12 | 3 | BMBL |
Bumble Inc.
Class B Common Stock |
1 | ||||||||
| 2021-02-09 |
|
4 | CYRX |
Cryoport, Inc.
4.0% Series C Convertible Preferred Stock |
C - Conversion | -1,140 | 4,561 | -20.00 | ||||
| 2021-02-09 |
|
4 | CYRX |
Cryoport, Inc.
4.0% Series C Convertible Preferred Stock |
C - Conversion | -48,860 | 195,439 | -20.00 | ||||
| 2021-02-09 |
|
4 | CYRX |
Cryoport, Inc.
Common Stock |
C - Conversion | 29,933 | 45,338 | 194.31 | ||||
| 2021-02-09 |
|
4 | CYRX |
Cryoport, Inc.
Common Stock |
C - Conversion | 1,282,927 | 1,943,058 | 194.34 | ||||
| 2020-12-31 |
|
4 | CQP |
Cheniere Energy Partners, L.P.
Common Units |
J - Other | 19,011 | 19,011 | |||||
| 2020-12-31 |
|
4 | CQP |
Cheniere Energy Partners, L.P.
Common Units |
J - Other | 54,348 | 54,348 | |||||
| 2020-12-31 |
|
4 | CQP |
Cheniere Energy Partners, L.P.
Common Units |
J - Other | -73,359 | 2,250,419 | -3.16 | ||||
| 2020-12-31 |
|
4 | CQP |
Cheniere Energy Partners, L.P.
Common Units |
P - Purchase | 46,101 | 2,323,778 | 2.02 | 34.14 | 1,573,888 | 79,333,781 | |
| 2020-12-31 |
|
4 | CQP |
Cheniere Energy Partners, L.P.
Common Units |
P - Purchase | 27,258 | 2,277,677 | 1.21 | 33.71 | 918,867 | 76,780,492 | |
| 2020-10-22 |
|
4 | PRAX |
Praxis Precision Medicines, Inc.
Series C-1 Redeemable Convertible Preferred Stock |
C - Conversion | -352,734 | 0 | -100.00 | ||||
| 2020-10-22 |
|
4 | PRAX |
Praxis Precision Medicines, Inc.
Series C Redeemable Convertible Preferred Stock |
C - Conversion | -1,941,748 | 0 | -100.00 | ||||
| 2020-10-22 |
|
4 | PRAX |
Praxis Precision Medicines, Inc.
Series C Redeemable Convertible Preferred Stock |
C - Conversion | -559,208 | 0 | -100.00 | ||||
| 2020-10-22 |
|
4 | PRAX |
Praxis Precision Medicines, Inc.
Series B-1 Redeemable Convertible Preferred Stock |
C - Conversion | -1,410,477 | 0 | -100.00 | ||||
| 2020-10-22 |
|
4 | PRAX |
Praxis Precision Medicines, Inc.
Series B Redeemable Convertible Preferred Stock |
C - Conversion | -5,052,852 | 0 | -100.00 | ||||
| 2020-10-22 |
|
4 | PRAX |
Praxis Precision Medicines, Inc.
Series A Redeemable Convertible Preferred Stock |
C - Conversion | -7,375,799 | 0 | -100.00 | ||||
| 2020-10-22 |
|
4 | PRAX |
Praxis Precision Medicines, Inc.
Common Stock |
C - Conversion | 164,832 | 7,594,109 | 2.22 | ||||
| 2020-10-22 |
|
4 | PRAX |
Praxis Precision Medicines, Inc.
Common Stock |
C - Conversion | 907,378 | 907,378 | |||||
| 2020-10-22 |
|
4 | PRAX |
Praxis Precision Medicines, Inc.
Common Stock |
C - Conversion | 261,318 | 7,429,277 | 3.65 | ||||
| 2020-10-22 |
|
4 | PRAX |
Praxis Precision Medicines, Inc.
Common Stock |
C - Conversion | 659,116 | 7,167,959 | 10.13 | ||||
| 2020-10-22 |
|
4 | PRAX |
Praxis Precision Medicines, Inc.
Common Stock |
C - Conversion | 2,361,198 | 6,508,843 | 56.93 | ||||
| 2020-10-22 |
|
4 | PRAX |
Praxis Precision Medicines, Inc.
Common Stock |
C - Conversion | 3,446,711 | 4,147,645 | 491.73 | ||||
| 2020-10-15 | 3 | PRAX |
Praxis Precision Medicines, Inc.
Common Stock |
700,934 | ||||||||
| 2020-10-13 | 3 | CYRX |
Cryoport, Inc.
Common Stock |
660,131 | ||||||||
| 2020-10-13 | 3 | CYRX |
Cryoport, Inc.
Common Stock |
15,405 | ||||||||
| 2020-10-01 |
|
4 | GRAY |
GRAYBUG VISION, INC.
Series C Preferred Stock |
C - Conversion | -395,068 | 0 | -100.00 | ||||
| 2020-10-01 |
|
4 | GRAY |
GRAYBUG VISION, INC.
Series B Preferred Stock |
C - Conversion | -1,285,327 | 0 | -100.00 | ||||
| 2020-10-01 |
|
4 | GRAY |
GRAYBUG VISION, INC.
Common Stock |
P - Purchase | 250,000 | 1,930,395 | 14.88 | 16.00 | 4,000,000 | 30,886,320 | |
| 2020-10-01 |
|
4 | GRAY |
GRAYBUG VISION, INC.
Common Stock |
C - Conversion | 395,068 | 1,680,395 | 30.74 | ||||
| 2020-10-01 |
|
4 | GRAY |
GRAYBUG VISION, INC.
Common Stock |
C - Conversion | 1,285,327 | 1,285,327 | |||||
| 2020-10-01 | 3 | EPIX |
ESSA Pharma Inc.
Common Shares |
3,573,053 | ||||||||
| 2020-09-28 |
|
4 | CQP |
Cheniere Energy Partners, L.P.
Common Units |
J - Other | -13,170,436 | 203,240,752 | -6.09 | ||||
| 2020-09-28 |
|
4 | CQP |
Cheniere Energy Partners, L.P.
Common Units |
J - Other | -101,600,052 | 203,240,752 | -33.33 | ||||
| 2020-09-04 |
|
4 | PACK |
Ranpak Holdings Corp.
Warrant (right to buy) |
J - Other | -358,400 | 0 | -100.00 | ||||
| 2020-09-04 |
|
4 | PACK |
Ranpak Holdings Corp.
Warrant (right to buy) |
J - Other | -2,201,600 | 0 | -100.00 | ||||
| 2020-09-04 |
|
4 | PACK |
Ranpak Holdings Corp.
Class A Common Stock |
J - Other | 78,848 | 712,348 | 12.45 | ||||
| 2020-09-04 |
|
4 | PACK |
Ranpak Holdings Corp.
Class A Common Stock |
J - Other | 484,352 | 4,375,852 | 12.45 | ||||
| 2020-07-30 |
|
4 | ANNX |
Annexon, Inc.
Series D Redeemable Convertible Preferred Stock |
C - Conversion | -2,109,407 | 0 | -100.00 | ||||
| 2020-07-30 |
|
4 | ANNX |
Annexon, Inc.
Series C Redeemable Convertible Preferred Stock |
C - Conversion | -6,148,147 | 0 | -100.00 | ||||
| 2020-07-30 |
|
4 | ANNX |
Annexon, Inc.
Series B Redeemable Convertible Preferred Stock |
C - Conversion | -8,370,685 | 0 | -100.00 | ||||
| 2020-07-30 |
|
4 | ANNX |
Annexon, Inc.
Series A-1 Redeemable Convertible Preferred Stock |
C - Conversion | -5,666,667 | 0 | -100.00 | ||||
| 2020-07-30 |
|
4 | ANNX |
Annexon, Inc.
Common Stock |
P - Purchase | 200,000 | 2,730,635 | 7.90 | 17.00 | 3,400,000 | 46,420,795 | |
| 2020-07-30 |
|
4 | ANNX |
Annexon, Inc.
Common Stock |
C - Conversion | 239,433 | 2,530,635 | 10.45 | ||||
| 2020-07-30 |
|
4 | ANNX |
Annexon, Inc.
Common Stock |
C - Conversion | 697,860 | 2,291,202 | 43.80 | ||||
| 2020-07-30 |
|
4 | ANNX |
Annexon, Inc.
Common Stock |
C - Conversion | 950,134 | 1,593,342 | 147.72 | ||||
| 2020-07-30 |
|
4 | ANNX |
Annexon, Inc.
Common Stock |
C - Conversion | 643,208 | 643,208 | |||||
| 2020-06-03 |
|
4 | FG |
FGL Holdings
Ordinary Shares |
S - Sale | -24,016 | 0 | -100.00 | ||||
| 2020-06-03 |
|
4 | FG |
FGL Holdings
Ordinary Shares |
S - Sale | -113,921 | 0 | -100.00 | ||||
| 2020-06-03 |
|
4 | FG |
FGL Holdings
Ordinary Shares |
S - Sale | -52,541 | 0 | -100.00 | ||||
| 2020-06-03 |
|
4 | FG |
FGL Holdings
Ordinary Shares |
S - Sale | -165,079 | 0 | -100.00 | ||||
| 2020-06-03 |
|
4 | FG |
FGL Holdings
Ordinary Shares |
S - Sale | -50,912 | 0 | -100.00 | ||||
| 2020-06-03 |
|
4 | FG |
FGL Holdings
Ordinary Shares |
S - Sale | -1,442,118 | 0 | -100.00 | ||||
| 2020-06-03 |
|
4 | FG |
FGL Holdings
Ordinary Shares |
S - Sale | -4,147,302 | 0 | -100.00 | ||||
| 2020-06-03 |
|
4 | FG |
FGL Holdings
Ordinary Shares |
S - Sale | -142,111 | 0 | -100.00 | ||||
| 2020-06-03 |
|
4 | FG |
FGL Holdings
Ordinary Shares |
S - Sale | -42,743 | 0 | -100.00 | ||||
| 2020-06-03 |
|
4 | FG |
FGL Holdings
Ordinary Shares |
S - Sale | -22,500,000 | 0 | -100.00 | ||||
| 2020-06-03 |
|
4 | FG |
FGL Holdings
Ordinary Shares |
S - Sale | -16,620,850 | 0 | -100.00 | ||||
| 2020-04-17 |
|
4 | TGE |
Tallgrass Energy, LP
Class A shares |
P - Purchase | 152,770,061 | 0 | -100.00 | 22.45 | 3,429,687,869 | ||
| 2020-03-25 |
|
4 | CQP |
Cheniere Energy Partners, L.P.
Common Units |
P - Purchase | 156,792 | 2,250,419 | 7.49 | 21.85 | 3,426,407 | 49,178,856 | |
| 2020-03-23 |
|
4 | CQP |
Cheniere Energy Partners, L.P.
Common Units |
P - Purchase | 166,310 | 2,093,627 | 8.63 | 21.66 | 3,601,443 | 45,337,493 | |
| 2020-03-23 |
|
4 | CQP |
Cheniere Energy Partners, L.P.
Common Units |
P - Purchase | 81,429 | 1,927,317 | 4.41 | 20.51 | 1,670,198 | 39,531,392 | |
| 2020-03-23 |
|
4 | CQP |
Cheniere Energy Partners, L.P.
Common Units |
P - Purchase | 154,728 | 1,845,888 | 9.15 | 20.24 | 3,132,020 | 37,364,649 | |
| 2020-03-18 |
|
4 | CQP |
Cheniere Energy Partners, L.P.
Common Units |
P - Purchase | 62,209 | 1,691,160 | 3.82 | 25.93 | 1,613,073 | 43,851,610 | |
| 2020-03-18 |
|
4 | CQP |
Cheniere Energy Partners, L.P.
Common Units |
P - Purchase | 273,497 | 1,628,951 | 20.18 | 24.99 | 6,834,143 | 40,704,228 | |
| 2020-03-18 |
|
4 | CQP |
Cheniere Energy Partners, L.P.
Common Units |
P - Purchase | 484,211 | 1,355,454 | 55.58 | 26.36 | 12,763,511 | 35,728,954 | |
| 2020-03-18 |
|
4 | CQP |
Cheniere Energy Partners, L.P.
Common Units |
P - Purchase | 126,198 | 871,243 | 16.94 | 25.78 | 3,253,851 | 22,463,868 | |
| 2020-03-16 |
|
4 | CQP |
Cheniere Energy Partners, L.P.
Common Units |
P - Purchase | 8,640 | 745,045 | 1.17 | 26.96 | 232,898 | 20,083,284 | |
| 2020-03-16 |
|
4 | CQP |
Cheniere Energy Partners, L.P.
Common Units |
P - Purchase | 60,347 | 736,405 | 8.93 | 26.22 | 1,582,461 | 19,310,527 | |
| 2020-03-16 |
|
4 | CQP |
Cheniere Energy Partners, L.P.
Common Units |
P - Purchase | 202,919 | 676,058 | 42.89 | 26.33 | 5,342,066 | 17,797,971 | |
| 2020-03-16 |
|
4 | CQP |
Cheniere Energy Partners, L.P.
Common Units |
P - Purchase | 131,046 | 473,139 | 38.31 | 25.54 | 3,346,627 | 12,082,929 | |
| 2020-03-12 |
|
4 | CQP |
Cheniere Energy Partners, L.P.
Common Units |
P - Purchase | 1,777 | 342,093 | 0.52 | 28.25 | 50,199 | 9,663,854 | |
| 2020-03-12 |
|
4 | CQP |
Cheniere Energy Partners, L.P.
Common Units |
P - Purchase | 12,554 | 340,316 | 3.83 | 27.47 | 344,902 | 9,349,672 | |
| 2020-03-12 |
|
4 | CQP |
Cheniere Energy Partners, L.P.
Common Units |
P - Purchase | 7,567 | 327,762 | 2.36 | 27.91 | 211,194 | 9,147,805 | |
| 2020-03-12 |
|
4 | CQP |
Cheniere Energy Partners, L.P.
Common Units |
P - Purchase | 1,281 | 320,195 | 0.40 | 26.67 | 34,168 | 8,540,593 | |
| 2020-03-12 |
|
4 | CQP |
Cheniere Energy Partners, L.P.
Common Units |
P - Purchase | 318,914 | 318,914 | 25.72 | 8,203,489 | 8,203,489 | ||
| 2020-02-24 | 3 | ATCX |
ATLAS TECHNICAL CONSULTANTS, INC.
Class A Common Stock |
4,400,000 | ||||||||
| 2020-02-24 | 3 | ATCX |
ATLAS TECHNICAL CONSULTANTS, INC.
Class A Common Stock |
4,400,000 | ||||||||
| 2020-02-24 | 3 | ATCX |
ATLAS TECHNICAL CONSULTANTS, INC.
Class A Common Stock |
4,400,000 | ||||||||
| 2020-02-24 | 3 | ATCX |
ATLAS TECHNICAL CONSULTANTS, INC.
Class A Common Stock |
4,400,000 | ||||||||
| 2020-02-24 | 3 | ATCX |
ATLAS TECHNICAL CONSULTANTS, INC.
Class A Common Stock |
4,400,000 | ||||||||
| 2020-02-24 | 3 | ATCX |
ATLAS TECHNICAL CONSULTANTS, INC.
Class A Common Stock |
4,400,000 | ||||||||
| 2020-02-24 | 3 | ATCX |
ATLAS TECHNICAL CONSULTANTS, INC.
Class A Common Stock |
4,400,000 | ||||||||
| 2020-02-24 | 3 | ATCX |
ATLAS TECHNICAL CONSULTANTS, INC.
Class A Common Stock |
4,400,000 | ||||||||
| 2020-02-24 | 3 | ATCX |
ATLAS TECHNICAL CONSULTANTS, INC.
Class A Common Stock |
4,400,000 | ||||||||
| 2020-02-24 | 3 | ATCX |
ATLAS TECHNICAL CONSULTANTS, INC.
Class A Common Stock |
4,400,000 | ||||||||
| 2020-02-04 | 3 | TGE |
Tallgrass Energy, LP
Class A Shares |
125,081,094 | ||||||||
| 2020-02-04 | 3 | TGE |
Tallgrass Energy, LP
Class A Shares |
125,435,519 | ||||||||
| 2020-02-04 | 3 | TGE |
Tallgrass Energy, LP
Class A Shares |
146,058,602 | ||||||||
| 2020-02-04 | 3 | TGE |
Tallgrass Energy, LP
Class B Shares |
217,086,377 | ||||||||
| 2020-02-04 | 3 | TGE |
Tallgrass Energy, LP
Class B Shares |
132,183,912 | ||||||||
| 2020-02-04 | 3 | TGE |
Tallgrass Energy, LP
Class A Shares |
125,081,094 | ||||||||
| 2020-02-04 | 3 | TGE |
Tallgrass Energy, LP
Class A Shares |
125,435,519 | ||||||||
| 2020-02-04 | 3 | TGE |
Tallgrass Energy, LP
Class A Shares |
146,058,602 | ||||||||
| 2020-02-04 | 3 | TGE |
Tallgrass Energy, LP
Class B Shares |
217,086,377 | ||||||||
| 2020-02-04 | 3 | TGE |
Tallgrass Energy, LP
Class B Shares |
132,183,912 | ||||||||
| 2019-12-04 |
|
4 | KODK |
EASTMAN KODAK CO
Common Stock |
S - Sale | -1,226,470 | 0 | -100.00 | 2.50 | -3,066,175 | ||
| 2019-12-04 |
|
4 | KODK |
EASTMAN KODAK CO
Common Stock |
S - Sale | -986,236 | 0 | -100.00 | 2.50 | -2,465,590 | ||
| 2019-12-04 |
|
4 | KODK |
EASTMAN KODAK CO
Common Stock |
S - Sale | -6,103,867 | 0 | -100.00 | 2.50 | -15,259,668 | ||
| 2019-12-04 |
|
4 | KODK |
EASTMAN KODAK CO
Common Stock |
S - Sale | -285,769 | 0 | -100.00 | 2.50 | -714,422 | ||
| 2019-12-04 |
|
4 | KODK |
EASTMAN KODAK CO
Common Stock |
S - Sale | -272,869 | 0 | -100.00 | 2.50 | -682,172 | ||
| 2019-11-27 |
|
4 | INVH |
Invitation Homes Inc.
Common Stock |
S - Sale | -4,720,172 | 29,651 | -99.38 | 30.05 | -141,841,169 | 891,013 | |
| 2019-11-27 |
|
4 | INVH |
Invitation Homes Inc.
Common Stock |
S - Sale | -3,984,790 | 33,223 | -99.17 | 30.05 | -119,742,940 | 998,351 | |
| 2019-11-27 |
|
4 | INVH |
Invitation Homes Inc.
Common Stock |
S - Sale | -5,212,503 | 39,106 | -99.26 | 30.05 | -156,635,715 | 1,175,135 | |
| 2019-11-27 |
|
4 | INVH |
Invitation Homes Inc.
Common Stock |
S - Sale | -8,888,562 | 20,353 | -99.77 | 30.05 | -267,101,288 | 611,608 | |
| 2019-11-27 |
|
4 | INVH |
Invitation Homes Inc.
Common Stock |
S - Sale | -2,251,159 | 21,051 | -99.07 | 30.05 | -67,647,328 | 632,583 | |
| 2019-11-27 |
|
4 | INVH |
Invitation Homes Inc.
Common Stock |
S - Sale | -11,494,129 | 0 | -100.00 | 30.05 | -345,398,576 | ||
| 2019-11-27 |
|
4 | INVH |
Invitation Homes Inc.
Common Stock |
S - Sale | -21,048,685 | 157,068 | -99.26 | 30.05 | -632,512,984 | 4,719,893 | |
| 2019-11-14 |
|
4 | GRTX |
Galera Therapeutics, Inc.
Series C Redeemable Convertible Preferred Stock |
C - Conversion | -561,385 | 0 | -100.00 | ||||
| 2019-11-14 |
|
4 | GRTX |
Galera Therapeutics, Inc.
Series C Redeemable Convertible Preferred Stock |
C - Conversion | -2,807,372 | 0 | -100.00 | ||||
| 2019-11-14 |
|
4 | GRTX |
Galera Therapeutics, Inc.
Series C Redeemable Convertible Preferred Stock |
C - Conversion | -1,552,035 | 0 | -100.00 | ||||
| 2019-11-14 |
|
4 | GRTX |
Galera Therapeutics, Inc.
Series C Redeemable Convertible Preferred Stock |
C - Conversion | -2,334,966 | 0 | -100.00 | ||||
| 2019-11-14 |
|
4 | GRTX |
Galera Therapeutics, Inc.
Common Stock |
P - Purchase | 19,423 | 130,444 | 17.49 | 12.00 | 233,076 | 1,565,328 | |
| 2019-11-14 |
|
4 | GRTX |
Galera Therapeutics, Inc.
Common Stock |
P - Purchase | 97,131 | 652,324 | 17.49 | 12.00 | 1,165,572 | 7,827,888 | |
| 2019-11-14 |
|
4 | GRTX |
Galera Therapeutics, Inc.
Common Stock |
P - Purchase | 52,660 | 353,661 | 17.49 | 12.00 | 631,920 | 4,243,932 | |
| 2019-11-14 |
|
4 | GRTX |
Galera Therapeutics, Inc.
Common Stock |
P - Purchase | 80,786 | 542,555 | 17.49 | 12.00 | 969,432 | 6,510,660 | |
| 2019-11-14 |
|
4 | GRTX |
Galera Therapeutics, Inc.
Common Stock |
C - Conversion | 111,021 | 111,021 | |||||
| 2019-11-14 |
|
4 | GRTX |
Galera Therapeutics, Inc.
Common Stock |
C - Conversion | 555,193 | 555,193 | |||||
| 2019-11-14 |
|
4 | GRTX |
Galera Therapeutics, Inc.
Common Stock |
C - Conversion | 301,001 | 301,001 | |||||
| 2019-11-14 |
|
4 | GRTX |
Galera Therapeutics, Inc.
Common Stock |
C - Conversion | 461,769 | 461,769 | |||||
| 2019-09-25 |
|
4 | INVH |
Invitation Homes Inc.
Common Stock |
S - Sale | -3,612,142 | 4,749,823 | -43.20 | 28.18 | -101,790,162 | 133,850,012 | |
| 2019-09-25 |
|
4 | INVH |
Invitation Homes Inc.
Common Stock |
S - Sale | -3,047,698 | 4,018,013 | -43.13 | 28.18 | -85,884,130 | 113,227,606 | |
| 2019-09-25 |
|
4 | INVH |
Invitation Homes Inc.
Common Stock |
S - Sale | -3,985,695 | 5,251,609 | -43.15 | 28.18 | -112,316,885 | 147,990,342 | |
| 2019-09-25 |
|
4 | INVH |
Invitation Homes Inc.
Common Stock |
S - Sale | -6,800,952 | 8,908,915 | -43.29 | 28.18 | -191,650,827 | 251,053,225 | |
| 2019-09-25 |
|
4 | INVH |
Invitation Homes Inc.
Common Stock |
S - Sale | -1,721,311 | 2,272,210 | -43.10 | 28.18 | -48,506,544 | 64,030,878 | |
| 2019-09-25 |
|
4 | INVH |
Invitation Homes Inc.
Common Stock |
S - Sale | -8,797,037 | 11,494,129 | -43.35 | 28.18 | -247,900,503 | 323,904,555 | |
| 2019-09-25 |
|
4 | INVH |
Invitation Homes Inc.
Common Stock |
S - Sale | -16,035,165 | 21,205,753 | -43.06 | 28.18 | -451,870,950 | 597,578,120 | |
| 2019-06-28 |
|
4 | INVH |
Invitation Homes Inc.
Common Stock |
S - Sale | -3,077,139 | 8,376,967 | -26.86 | 27.43 | -84,405,923 | 229,780,205 | |
| 2019-06-28 |
|
4 | INVH |
Invitation Homes Inc.
Common Stock |
S - Sale | -2,596,858 | 7,081,659 | -26.83 | 27.43 | -71,231,815 | 194,249,906 | |
| 2019-06-28 |
|
4 | INVH |
Invitation Homes Inc.
Common Stock |
S - Sale | -3,396,754 | 9,256,381 | -26.85 | 27.43 | -93,172,962 | 253,902,531 | |
| 2019-06-28 |
|
4 | INVH |
Invitation Homes Inc.
Common Stock |
S - Sale | -5,799,303 | 15,719,858 | -26.95 | 27.43 | -159,074,881 | 431,195,705 | |
| 2019-06-28 |
|
4 | INVH |
Invitation Homes Inc.
Common Stock |
S - Sale | -1,466,617 | 4,003,653 | -26.81 | 27.43 | -40,229,304 | 109,820,202 | |
| 2019-06-28 |
|
4 | INVH |
Invitation Homes Inc.
Common Stock |
S - Sale | -7,503,395 | 20,291,166 | -27.00 | 27.43 | -205,818,125 | 556,586,683 | |
| 2019-06-28 |
|
4 | INVH |
Invitation Homes Inc.
Common Stock |
S - Sale | -13,659,934 | 37,352,153 | -26.78 | 27.43 | -374,691,990 | 1,024,569,557 | |
| 2019-06-11 | 3 | PACK |
Ranpak Holdings Corp.
Class A Common Stock |
8,416,500 | ||||||||
| 2019-06-11 | 3 | PACK |
Ranpak Holdings Corp.
Class A Common Stock |
5,158,500 | ||||||||
| 2019-06-11 | 3 | PACK |
Ranpak Holdings Corp.
Class A Common Stock |
8,416,500 | ||||||||
| 2019-06-11 | 3 | PACK |
Ranpak Holdings Corp.
Class A Common Stock |
5,158,500 | ||||||||
| 2019-06-11 | 3 | PACK |
Ranpak Holdings Corp.
Class A Common Stock |
8,416,500 | ||||||||
| 2019-06-11 | 3 | PACK |
Ranpak Holdings Corp.
Class A Common Stock |
5,158,500 | ||||||||
| 2019-06-11 | 3 | PACK |
Ranpak Holdings Corp.
Class A Common Stock |
8,416,500 | ||||||||
| 2019-06-11 | 3 | PACK |
Ranpak Holdings Corp.
Class A Common Stock |
5,158,500 | ||||||||
| 2019-06-11 | 3 | PACK |
Ranpak Holdings Corp.
Class A Common Stock |
8,416,500 | ||||||||
| 2019-06-11 | 3 | PACK |
Ranpak Holdings Corp.
Class A Common Stock |
5,158,500 | ||||||||
| 2019-06-11 | 3 | PACK |
Ranpak Holdings Corp.
Class A Common Stock |
8,416,500 | ||||||||
| 2019-06-11 | 3 | PACK |
Ranpak Holdings Corp.
Class A Common Stock |
5,158,500 | ||||||||
| 2019-06-11 | 3 | PACK |
Ranpak Holdings Corp.
Class A Common Stock |
8,416,500 | ||||||||
| 2019-06-11 | 3 | PACK |
Ranpak Holdings Corp.
Class A Common Stock |
5,158,500 | ||||||||
| 2019-06-11 | 3 | PACK |
Ranpak Holdings Corp.
Class A Common Stock |
8,416,500 | ||||||||
| 2019-06-11 | 3 | PACK |
Ranpak Holdings Corp.
Class A Common Stock |
5,158,500 | ||||||||
| 2019-06-11 | 3 | PACK |
Ranpak Holdings Corp.
Class A Common Stock |
8,416,500 | ||||||||
| 2019-06-11 | 3 | PACK |
Ranpak Holdings Corp.
Class A Common Stock |
5,158,500 | ||||||||
| 2019-06-11 | 3 | PACK |
Ranpak Holdings Corp.
Class A Common Stock |
8,416,500 | ||||||||
| 2019-06-11 | 3 | PACK |
Ranpak Holdings Corp.
Class A Common Stock |
5,158,500 | ||||||||
| 2019-06-11 | 3 | PACK |
Ranpak Holdings Corp.
Class A Common Stock |
8,416,500 | ||||||||
| 2019-06-11 | 3 | PACK |
Ranpak Holdings Corp.
Class A Common Stock |
5,158,500 | ||||||||
| 2019-06-11 | 3 | PACK |
Ranpak Holdings Corp.
Class A Common Stock |
8,416,500 | ||||||||
| 2019-06-11 | 3 | PACK |
Ranpak Holdings Corp.
Class A Common Stock |
5,158,500 | ||||||||
| 2019-06-05 |
|
4 | INVH |
Invitation Homes Inc.
Common Stock |
S - Sale | -3,288,249 | 11,467,109 | -22.29 | 25.21 | -82,896,757 | 289,085,818 | |
| 2019-06-05 |
|
4 | INVH |
Invitation Homes Inc.
Common Stock |
S - Sale | -2,771,535 | 9,706,094 | -22.21 | 25.21 | -69,870,397 | 244,690,630 | |
| 2019-06-05 |
|
4 | INVH |
Invitation Homes Inc.
Common Stock |
S - Sale | -3,624,083 | 12,688,693 | -22.22 | 25.21 | -91,363,132 | 319,881,951 | |
| 2019-06-05 |
|
4 | INVH |
Invitation Homes Inc.
Common Stock |
S - Sale | -6,185,782 | 21,537,132 | -22.31 | 25.21 | -155,943,564 | 542,951,098 | |
| 2019-06-05 |
|
4 | INVH |
Invitation Homes Inc.
Common Stock |
S - Sale | -1,565,920 | 5,489,547 | -22.19 | 25.21 | -39,476,843 | 138,391,480 | |
| 2019-06-05 |
|
4 | INVH |
Invitation Homes Inc.
Common Stock |
S - Sale | -8,001,642 | 27,794,561 | -22.35 | 25.21 | -201,721,395 | 700,700,883 | |
| 2019-06-05 |
|
4 | INVH |
Invitation Homes Inc.
Common Stock |
S - Sale | -14,562,789 | 51,262,213 | -22.12 | 25.21 | -367,127,911 | 1,292,320,390 | |
| 2019-03-27 |
|
4 | INVH |
Invitation Homes Inc.
Common Stock |
S - Sale | -3,293,385 | 14,755,358 | -18.25 | 23.22 | -76,472,400 | 342,619,413 | |
| 2019-03-27 |
|
4 | INVH |
Invitation Homes Inc.
Common Stock |
S - Sale | -2,773,242 | 12,477,629 | -18.18 | 23.22 | -64,394,679 | 289,730,545 | |
| 2019-03-27 |
|
4 | INVH |
Invitation Homes Inc.
Common Stock |
S - Sale | -3,625,333 | 16,312,776 | -18.18 | 23.22 | -84,180,232 | 378,782,659 | |
| 2019-03-27 |
|
4 | INVH |
Invitation Homes Inc.
Common Stock |
S - Sale | -6,185,794 | 27,722,914 | -18.24 | 23.22 | -143,634,137 | 643,726,063 | |
| 2019-03-27 |
|
4 | INVH |
Invitation Homes Inc.
Common Stock |
S - Sale | -1,564,279 | 7,055,467 | -18.15 | 23.22 | -36,322,558 | 163,827,944 | |
| 2019-03-27 |
|
4 | INVH |
Invitation Homes Inc.
Common Stock |
S - Sale | -8,000,928 | 35,796,203 | -18.27 | 23.22 | -185,781,548 | 831,187,834 | |
| 2019-03-27 |
|
4 | INVH |
Invitation Homes Inc.
Common Stock |
S - Sale | -14,557,039 | 65,825,002 | -18.11 | 23.22 | -338,014,446 | 1,528,456,546 | |
| 2019-03-22 |
|
4 | NSTG |
NanoString Technologies Inc
Common Stock |
S - Sale | -2,000,000 | 2,036,025 | -49.55 | 21.62 | -43,240,000 | 44,018,860 | |
| 2019-01-15 | 3 | NSTG |
NanoString Technologies Inc
Common Stock |
8,072,050 | ||||||||
| 2019-01-15 | 3 | NSTG |
NanoString Technologies Inc
Common Stock |
8,072,050 | ||||||||
| 2019-01-15 | 3 | NSTG |
NanoString Technologies Inc
Common Stock |
8,072,050 | ||||||||
| 2019-01-15 | 3 | NSTG |
NanoString Technologies Inc
Common Stock |
8,072,050 | ||||||||
| 2019-01-15 | 3 | NSTG |
NanoString Technologies Inc
Common Stock |
8,072,050 | ||||||||
| 2019-01-15 | 3 | NSTG |
NanoString Technologies Inc
Common Stock |
8,072,050 | ||||||||
| 2019-01-15 | 3 | NSTG |
NanoString Technologies Inc
Common Stock |
8,072,050 | ||||||||
| 2019-01-15 | 3 | NSTG |
NanoString Technologies Inc
Common Stock |
8,072,050 | ||||||||
| 2019-01-15 | 3 | FTSV |
Forty Seven, Inc.
Common Stock |
7,633,902 | ||||||||
| 2019-01-15 | 3 | FTSV |
Forty Seven, Inc.
Common Stock |
7,633,902 | ||||||||
| 2019-01-15 | 3 | FTSV |
Forty Seven, Inc.
Common Stock |
7,633,902 | ||||||||
| 2019-01-15 | 3 | FTSV |
Forty Seven, Inc.
Common Stock |
7,633,902 | ||||||||
| 2019-01-15 | 3 | FTSV |
Forty Seven, Inc.
Common Stock |
7,633,902 | ||||||||
| 2019-01-15 | 3 | FTSV |
Forty Seven, Inc.
Common Stock |
7,633,902 | ||||||||
| 2019-01-15 | 3 | FTSV |
Forty Seven, Inc.
Common Stock |
7,633,902 | ||||||||
| 2019-01-15 | 3 | FTSV |
Forty Seven, Inc.
Common Stock |
7,633,902 | ||||||||
| 2019-01-15 | 3 | ETTX |
Entasis Therapeutics Holdings Inc.
Common Stock |
3,246,810 | ||||||||
| 2019-01-15 | 3 | ETTX |
Entasis Therapeutics Holdings Inc.
Common Stock |
3,246,810 | ||||||||
| 2019-01-15 | 3 | ETTX |
Entasis Therapeutics Holdings Inc.
Common Stock |
3,246,810 | ||||||||
| 2019-01-15 | 3 | ETTX |
Entasis Therapeutics Holdings Inc.
Common Stock |
3,246,810 | ||||||||
| 2019-01-15 | 3 | ETTX |
Entasis Therapeutics Holdings Inc.
Common Stock |
3,246,810 | ||||||||
| 2019-01-15 | 3 | ETTX |
Entasis Therapeutics Holdings Inc.
Common Stock |
3,246,810 | ||||||||
| 2019-01-15 | 3 | ETTX |
Entasis Therapeutics Holdings Inc.
Common Stock |
3,246,810 | ||||||||
| 2019-01-15 | 3 | ETTX |
Entasis Therapeutics Holdings Inc.
Common Stock |
3,246,810 | ||||||||
| 2019-01-15 | 3 | AVRO |
AVROBIO, Inc.
Common Stock |
5,924,650 | ||||||||
| 2019-01-15 | 3 | AVRO |
AVROBIO, Inc.
Common Stock |
5,924,650 | ||||||||
| 2019-01-15 | 3 | AVRO |
AVROBIO, Inc.
Common Stock |
5,924,650 | ||||||||
| 2019-01-15 | 3 | AVRO |
AVROBIO, Inc.
Common Stock |
5,924,650 | ||||||||
| 2019-01-15 | 3 | AVRO |
AVROBIO, Inc.
Common Stock |
5,924,650 | ||||||||
| 2019-01-15 | 3 | AVRO |
AVROBIO, Inc.
Common Stock |
5,924,650 | ||||||||
| 2019-01-15 | 3 | AVRO |
AVROBIO, Inc.
Common Stock |
5,924,650 | ||||||||
| 2019-01-15 | 3 | AVRO |
AVROBIO, Inc.
Common Stock |
5,924,650 | ||||||||
| 2018-11-08 | 3 | DFBG |
Centric Brands Inc.
Common Stock |
35,578,250 | ||||||||
| 2018-11-08 | 3 | DFBG |
Centric Brands Inc.
Common Stock |
34,529,402 | ||||||||
| 2018-11-08 | 3 | DFBG |
Centric Brands Inc.
Common Stock |
27,021,680 | ||||||||
| 2018-11-08 | 3 | DFBG |
Centric Brands Inc.
Common Stock |
26,353,198 | ||||||||
| 2018-11-08 | 3 | DFBG |
Centric Brands Inc.
Common Stock |
26,332,475 | ||||||||
| 2018-11-08 | 3 | DFBG |
Centric Brands Inc.
Common Stock |
33,664,975 | ||||||||
| 2018-11-08 | 3 | DFBG |
Centric Brands Inc.
Common Stock |
26,276,028 | ||||||||
| 2018-11-08 | 3 | DFBG |
Centric Brands Inc.
Common Stock |
35,578,250 | ||||||||
| 2018-11-08 | 3 | DFBG |
Centric Brands Inc.
Common Stock |
34,529,402 | ||||||||
| 2018-11-08 | 3 | DFBG |
Centric Brands Inc.
Common Stock |
27,021,680 | ||||||||
| 2018-11-08 | 3 | DFBG |
Centric Brands Inc.
Common Stock |
26,353,198 | ||||||||
| 2018-11-08 | 3 | DFBG |
Centric Brands Inc.
Common Stock |
26,332,475 | ||||||||
| 2018-11-08 | 3 | DFBG |
Centric Brands Inc.
Common Stock |
33,664,975 | ||||||||
| 2018-11-08 | 3 | DFBG |
Centric Brands Inc.
Common Stock |
26,276,028 | ||||||||
| 2018-06-11 | 3 | CPLG |
CorePoint Lodging Inc.
Common Stock |
24,356,193 | ||||||||
| 2018-06-11 | 3 | CPLG |
CorePoint Lodging Inc.
Common Stock |
18,518,710 | ||||||||
| 2018-06-11 | 3 | CPLG |
CorePoint Lodging Inc.
Common Stock |
18,112,974 | ||||||||
| 2018-06-11 | 3 | CPLG |
CorePoint Lodging Inc.
Common Stock |
17,763,585 | ||||||||
| 2018-06-11 | 3 | CPLG |
CorePoint Lodging Inc.
Common Stock |
17,658,169 | ||||||||
| 2018-06-11 | 3 | CPLG |
CorePoint Lodging Inc.
Common Stock |
17,777,289 | ||||||||
| 2018-06-11 | 3 | CPLG |
CorePoint Lodging Inc.
Common Stock |
17,848,556 | ||||||||
| 2018-06-11 | 3 | CPLG |
CorePoint Lodging Inc.
Common Stock |
17,890,616 | ||||||||
| 2018-06-11 | 3 | CPLG |
CorePoint Lodging Inc.
Common Stock |
17,675,700 | ||||||||
| 2018-06-11 | 3 | CPLG |
CorePoint Lodging Inc.
Common Stock |
20,632,210 | ||||||||
| 2018-06-11 | 3 | CPLG |
CorePoint Lodging Inc.
Common Stock |
18,357,065 | ||||||||
| 2018-06-11 | 3 | CPLG |
CorePoint Lodging Inc.
Common Stock |
18,683,373 | ||||||||
| 2018-06-11 | 3 | CPLG |
CorePoint Lodging Inc.
Common Stock |
20,404,503 | ||||||||
| 2018-06-11 | 3 | CPLG |
CorePoint Lodging Inc.
Common Stock |
17,674,829 | ||||||||
| 2018-06-11 | 3 | CPLG |
CorePoint Lodging Inc.
Common Stock |
18,030,836 | ||||||||
| 2018-06-11 | 3 | CPLG |
CorePoint Lodging Inc.
Common Stock |
24,356,193 | ||||||||
| 2018-06-11 | 3 | CPLG |
CorePoint Lodging Inc.
Common Stock |
18,518,710 | ||||||||
| 2018-06-11 | 3 | CPLG |
CorePoint Lodging Inc.
Common Stock |
18,112,974 | ||||||||
| 2018-06-11 | 3 | CPLG |
CorePoint Lodging Inc.
Common Stock |
17,763,585 | ||||||||
| 2018-06-11 | 3 | CPLG |
CorePoint Lodging Inc.
Common Stock |
17,658,169 | ||||||||
| 2018-06-11 | 3 | CPLG |
CorePoint Lodging Inc.
Common Stock |
17,777,289 | ||||||||
| 2018-06-11 | 3 | CPLG |
CorePoint Lodging Inc.
Common Stock |
17,848,556 | ||||||||
| 2018-06-11 | 3 | CPLG |
CorePoint Lodging Inc.
Common Stock |
17,890,616 | ||||||||
| 2018-06-11 | 3 | CPLG |
CorePoint Lodging Inc.
Common Stock |
17,675,700 | ||||||||
| 2018-06-11 | 3 | CPLG |
CorePoint Lodging Inc.
Common Stock |
20,632,210 | ||||||||
| 2018-06-11 | 3 | CPLG |
CorePoint Lodging Inc.
Common Stock |
18,357,065 | ||||||||
| 2018-06-11 | 3 | CPLG |
CorePoint Lodging Inc.
Common Stock |
18,683,373 | ||||||||
| 2018-06-11 | 3 | CPLG |
CorePoint Lodging Inc.
Common Stock |
20,404,503 | ||||||||
| 2018-06-11 | 3 | CPLG |
CorePoint Lodging Inc.
Common Stock |
17,674,829 | ||||||||
| 2018-06-11 | 3 | CPLG |
CorePoint Lodging Inc.
Common Stock |
18,030,836 | ||||||||
| 2018-06-01 |
|
4 | LQ |
La Quinta Holdings Inc.
Common Stock |
J - Other | -444,298 | 0 | -100.00 | 16.80 | -7,464,206 | ||
| 2018-06-01 |
|
4 | LQ |
La Quinta Holdings Inc.
Common Stock |
J - Other | -88,291 | 0 | -100.00 | 16.80 | -1,483,289 | ||
| 2018-06-01 |
|
4 | LQ |
La Quinta Holdings Inc.
Common Stock |
J - Other | -2,817,965 | 0 | -100.00 | 16.80 | -47,341,812 | ||
| 2018-06-01 |
|
4 | LQ |
La Quinta Holdings Inc.
Common Stock |
J - Other | -1,096,835 | 0 | -100.00 | 16.80 | -18,426,828 | ||
| 2018-06-01 |
|
4 | LQ |
La Quinta Holdings Inc.
Common Stock |
J - Other | -770,527 | 0 | -100.00 | 16.80 | -12,944,854 | ||
| 2018-06-01 |
|
4 | LQ |
La Quinta Holdings Inc.
Common Stock |
J - Other | -3,045,672 | 0 | -100.00 | 16.80 | -51,167,290 | ||
| 2018-06-01 |
|
4 | LQ |
La Quinta Holdings Inc.
Common Stock |
J - Other | -89,162 | 0 | -100.00 | 16.80 | -1,497,922 | ||
| 2018-06-01 |
|
4 | LQ |
La Quinta Holdings Inc.
Common Stock |
J - Other | -304,078 | 0 | -100.00 | 16.80 | -5,108,510 | ||
| 2018-06-01 |
|
4 | LQ |
La Quinta Holdings Inc.
Common Stock |
J - Other | -262,018 | 0 | -100.00 | 16.80 | -4,401,902 | ||
| 2018-06-01 |
|
4 | LQ |
La Quinta Holdings Inc.
Common Stock |
J - Other | -190,751 | 0 | -100.00 | 16.80 | -3,204,617 | ||
| 2018-06-01 |
|
4 | LQ |
La Quinta Holdings Inc.
Common Stock |
J - Other | -71,631 | 0 | -100.00 | 16.80 | -1,203,401 | ||
| 2018-06-01 |
|
4 | LQ |
La Quinta Holdings Inc.
Common Stock |
J - Other | -177,047 | 0 | -100.00 | 16.80 | -2,974,390 | ||
| 2018-06-01 |
|
4 | LQ |
La Quinta Holdings Inc.
Common Stock |
J - Other | -526,436 | 0 | -100.00 | 16.80 | -8,844,125 | ||
| 2018-06-01 |
|
4 | LQ |
La Quinta Holdings Inc.
Common Stock |
J - Other | -932,172 | 0 | -100.00 | 16.80 | -15,660,490 | ||
| 2018-06-01 |
|
4 | LQ |
La Quinta Holdings Inc.
Common Stock |
J - Other | -6,769,655 | 0 | -100.00 | 16.80 | -113,730,204 | ||
| 2018-05-14 |
|
4 | HCC |
WARRIOR MET COAL, INC.
Common Stock |
S - Sale | -296,669 | 642,881 | -31.58 | 24.20 | -7,179,390 | 15,557,720 | |
| 2018-05-14 |
|
4 | HCC |
WARRIOR MET COAL, INC.
Common Stock |
S - Sale | -167,405 | 362,766 | -31.58 | 24.20 | -4,051,201 | 8,778,937 | |
| 2018-05-14 |
|
4 | HCC |
WARRIOR MET COAL, INC.
Common Stock |
S - Sale | -17,097 | 37,050 | -31.58 | 24.20 | -413,747 | 896,610 | |
| 2018-05-14 |
|
4 | HCC |
WARRIOR MET COAL, INC.
Common Stock |
S - Sale | -48,711 | 105,558 | -31.58 | 24.20 | -1,178,806 | 2,554,504 | |
| 2018-05-14 |
|
4 | HCC |
WARRIOR MET COAL, INC.
Common Stock |
S - Sale | -126,800 | 274,775 | -31.58 | 24.20 | -3,068,560 | 6,649,555 | |
| 2018-05-14 |
|
4 | HCC |
WARRIOR MET COAL, INC.
Common Stock |
S - Sale | -111,564 | 241,761 | -31.58 | 24.20 | -2,699,849 | 5,850,616 | |
| 2018-05-14 |
|
4 | HCC |
WARRIOR MET COAL, INC.
Common Stock |
S - Sale | -60,369 | 130,821 | -31.58 | 24.20 | -1,460,930 | 3,165,868 | |
| 2018-05-14 |
|
4 | HCC |
WARRIOR MET COAL, INC.
Common Stock |
S - Sale | -53,348 | 115,606 | -31.58 | 24.20 | -1,291,022 | 2,797,665 | |
| 2018-05-14 |
|
4 | HCC |
WARRIOR MET COAL, INC.
Common Stock |
S - Sale | -462,967 | 1,003,247 | -31.58 | 24.20 | -11,203,801 | 24,278,577 | |
| 2018-05-14 |
|
4 | HCC |
WARRIOR MET COAL, INC.
Common Stock |
S - Sale | -524,749 | 1,137,128 | -31.58 | 24.20 | -12,698,926 | 27,518,498 | |
| 2018-01-31 | 3 | OMAD |
One Madison Corp
Class A Ordinary Shares |
7,965,000 | ||||||||
| 2018-01-31 | 3 | OMAD |
One Madison Corp
Class A Ordinary Shares |
5,085,000 | ||||||||
| 2018-01-31 | 3 | OMAD |
One Madison Corp
Class B Ordinary Shares |
4,976,500 | ||||||||
| 2018-01-31 | 3 | OMAD |
One Madison Corp
Class B Ordinary Shares |
4,598,500 | ||||||||
| 2018-01-31 | 3 | OMAD |
One Madison Corp
Class A Ordinary Shares |
7,965,000 | ||||||||
| 2018-01-31 | 3 | OMAD |
One Madison Corp
Class A Ordinary Shares |
5,085,000 | ||||||||
| 2018-01-31 | 3 | OMAD |
One Madison Corp
Class B Ordinary Shares |
4,976,500 | ||||||||
| 2018-01-31 | 3 | OMAD |
One Madison Corp
Class B Ordinary Shares |
4,598,500 | ||||||||
| 2018-01-02 |
|
4 | CQP |
Cheniere Energy Partners, L.P.
Common Units |
P - Purchase | 231,288 | 2,011,447 | 12.99 | 29.49 | 6,820,197 | 59,313,348 | |
| 2018-01-02 |
|
4 | CQP |
Cheniere Energy Partners, L.P.
Common Units |
P - Purchase | 228,535 | 1,780,159 | 14.73 | 29.63 | 6,772,543 | 52,754,300 | |
| 2017-12-28 |
|
4 | CQP |
Cheniere Energy Partners, L.P.
Common Units |
P - Purchase | 308,766 | 1,551,624 | 24.84 | 29.09 | 8,982,898 | 45,141,242 | |
| 2017-12-28 |
|
4 | CQP |
Cheniere Energy Partners, L.P.
Common Units |
P - Purchase | 25,466 | 1,242,858 | 2.09 | 28.61 | 728,679 | 35,562,890 | |
| 2017-12-26 |
|
4 | CQP |
Cheniere Energy Partners, L.P.
Common Units |
P - Purchase | 73,247 | 1,217,392 | 6.40 | 28.04 | 2,054,190 | 34,141,393 | |
| 2017-12-26 |
|
4 | CQP |
Cheniere Energy Partners, L.P.
Common Units |
P - Purchase | 42,976 | 1,144,145 | 3.90 | 27.85 | 1,196,933 | 31,865,811 | |
| 2017-12-11 |
|
4 | UAN |
CVR PARTNERS, LP
Common Units representing Limited Partner Interests |
S - Sale | -153,184 | 1,459,328 | -9.50 | 3.00 | -459,567 | 4,378,130 | |
| 2017-12-11 |
|
4 | UAN |
CVR PARTNERS, LP
Common Units representing Limited Partner Interests |
S - Sale | -85,424 | 153,909 | -35.69 | 3.00 | -256,281 | 461,742 | |
| 2017-12-11 |
|
4 | UAN |
CVR PARTNERS, LP
Common Units representing Limited Partner Interests |
S - Sale | -219,886 | 396,173 | -35.69 | 3.00 | -659,680 | 1,188,559 | |
| 2017-12-11 |
|
4 | UAN |
CVR PARTNERS, LP
Common Units representing Limited Partner Interests |
S - Sale | -85,485 | 154,021 | -35.69 | 3.00 | -256,464 | 462,078 | |
| 2017-12-11 |
|
4 | UAN |
CVR PARTNERS, LP
Common Units representing Limited Partner Interests |
S - Sale | -619,729 | 1,387,647 | -30.87 | 3.00 | -1,859,249 | 4,163,080 | |
| 2017-12-11 |
|
4 | UAN |
CVR PARTNERS, LP
Common Units representing Limited Partner Interests |
S - Sale | -736,292 | 1,055,521 | -41.09 | 3.00 | -2,208,950 | 3,166,669 | |
| 2017-12-11 | 3 | FG |
FGL Holdings
Ordinary Shares |
57,895,812 | ||||||||
| 2017-12-11 | 3 | FG |
FGL Holdings
Ordinary Shares |
65,766,906 | ||||||||
| 2017-12-11 | 3 | FG |
FGL Holdings
Ordinary Shares |
43,409,017 | ||||||||
| 2017-12-11 | 3 | FG |
FGL Holdings
Ordinary Shares |
47,414,208 | ||||||||
| 2017-12-11 | 3 | FG |
FGL Holdings
Ordinary Shares |
44,709,024 | ||||||||
| 2017-12-11 | 3 | FG |
FGL Holdings
Ordinary Shares |
43,317,818 | ||||||||
| 2017-12-11 | 3 | FG |
FGL Holdings
Ordinary Shares |
43,431,985 | ||||||||
| 2017-12-11 | 3 | FG |
FGL Holdings
Ordinary Shares |
43,319,447 | ||||||||
| 2017-12-11 | 3 | FG |
FGL Holdings
Ordinary Shares |
43,380,827 | ||||||||
| 2017-12-11 | 3 | FG |
FGL Holdings
Ordinary Shares |
43,290,922 | ||||||||
| 2017-12-11 | 3 | FG |
FGL Holdings
Ordinary Shares |
57,895,812 | ||||||||
| 2017-12-11 | 3 | FG |
FGL Holdings
Ordinary Shares |
65,766,906 | ||||||||
| 2017-12-11 | 3 | FG |
FGL Holdings
Ordinary Shares |
43,409,017 | ||||||||
| 2017-12-11 | 3 | FG |
FGL Holdings
Ordinary Shares |
47,414,208 | ||||||||
| 2017-12-11 | 3 | FG |
FGL Holdings
Ordinary Shares |
44,709,024 | ||||||||
| 2017-12-11 | 3 | FG |
FGL Holdings
Ordinary Shares |
43,317,818 | ||||||||
| 2017-12-11 | 3 | FG |
FGL Holdings
Ordinary Shares |
43,431,985 | ||||||||
| 2017-12-11 | 3 | FG |
FGL Holdings
Ordinary Shares |
43,319,447 | ||||||||
| 2017-12-11 | 3 | FG |
FGL Holdings
Ordinary Shares |
43,380,827 | ||||||||
| 2017-12-11 | 3 | FG |
FGL Holdings
Ordinary Shares |
43,290,922 | ||||||||
| 2017-12-04 | 3 | UAN |
CVR PARTNERS, LP
Common Units representing Limited Partner Interests |
13,727,774 | ||||||||
| 2017-12-04 | 3 | UAN |
CVR PARTNERS, LP
Common Units representing Limited Partner Interests |
13,351,048 | ||||||||
| 2017-12-04 | 3 | UAN |
CVR PARTNERS, LP
Common Units representing Limited Partner Interests |
13,351,221 | ||||||||
| 2017-12-04 | 3 | UAN |
CVR PARTNERS, LP
Common Units representing Limited Partner Interests |
16,086,871 | ||||||||
| 2017-12-04 | 3 | UAN |
CVR PARTNERS, LP
Common Units representing Limited Partner Interests |
14,724,227 | ||||||||
| 2017-12-04 | 3 | UAN |
CVR PARTNERS, LP
Common Units representing Limited Partner Interests |
16,741,675 | ||||||||
| 2017-12-04 | 3 | UAN |
CVR PARTNERS, LP
Common Units representing Limited Partner Interests |
14,903,528 | ||||||||
| 2017-12-04 | 3 | UAN |
CVR PARTNERS, LP
Common Units representing Limited Partner Interests |
15,119,091 | ||||||||
| 2017-12-04 | 3 | UAN |
CVR PARTNERS, LP
Common Units representing Limited Partner Interests |
13,727,774 | ||||||||
| 2017-12-04 | 3 | UAN |
CVR PARTNERS, LP
Common Units representing Limited Partner Interests |
13,351,048 | ||||||||
| 2017-12-04 | 3 | UAN |
CVR PARTNERS, LP
Common Units representing Limited Partner Interests |
13,351,221 | ||||||||
| 2017-12-04 | 3 | UAN |
CVR PARTNERS, LP
Common Units representing Limited Partner Interests |
16,086,871 | ||||||||
| 2017-12-04 | 3 | UAN |
CVR PARTNERS, LP
Common Units representing Limited Partner Interests |
14,724,227 | ||||||||
| 2017-12-04 | 3 | UAN |
CVR PARTNERS, LP
Common Units representing Limited Partner Interests |
16,741,675 | ||||||||
| 2017-12-04 | 3 | UAN |
CVR PARTNERS, LP
Common Units representing Limited Partner Interests |
14,903,528 | ||||||||
| 2017-12-04 | 3 | UAN |
CVR PARTNERS, LP
Common Units representing Limited Partner Interests |
15,119,091 | ||||||||
| 2017-09-11 |
|
4 | CJES |
C&J Energy Services, Inc.
Common Stock |
S - Sale | -1,500,000 | 5,020,635 | -23.00 | 27.11 | -40,665,000 | 136,109,415 | |
| 2017-08-04 |
|
4 | CQP |
Cheniere Energy Partners, L.P.
Class B Units |
C - Conversion | -100,000,000 | 0 | -100.00 | ||||
| 2017-08-04 |
|
4 | CQP |
Cheniere Energy Partners, L.P.
Common Units |
C - Conversion | 198,978,886 | 198,978,886 | |||||
| 2017-07-31 | 3 | CQP |
Cheniere Energy Partners, L.P.
Common Units |
4,572,970 | ||||||||
| 2017-07-31 | 3 | CQP |
Cheniere Energy Partners, L.P.
Common Units |
4,425,656 | ||||||||
| 2017-07-31 | 3 | CQP |
Cheniere Energy Partners, L.P.
Common Units |
4,425,656 | ||||||||
| 2017-07-31 | 3 | CQP |
Cheniere Energy Partners, L.P.
Common Units |
3,934,723 | ||||||||
| 2017-07-31 | 3 | CQP |
Cheniere Energy Partners, L.P.
Common Units |
4,572,970 | ||||||||
| 2017-07-31 | 3 | CQP |
Cheniere Energy Partners, L.P.
Common Units |
4,425,656 | ||||||||
| 2017-07-31 | 3 | CQP |
Cheniere Energy Partners, L.P.
Common Units |
4,425,656 | ||||||||
| 2017-07-31 | 3 | CQP |
Cheniere Energy Partners, L.P.
Common Units |
3,934,723 | ||||||||
| 2017-06-09 | 3/A | SN |
Sanchez Energy Corp
Common Stock |
531,847 | ||||||||
| 2017-06-09 | 3/A | SN |
Sanchez Energy Corp
Common Stock |
480,874 | ||||||||
| 2017-06-09 | 3/A | SN |
Sanchez Energy Corp
Common Stock |
93,389 | ||||||||
| 2017-06-09 | 3/A | SN |
Sanchez Energy Corp
Common Stock |
35,635 | ||||||||
| 2017-06-09 | 3/A | SN |
Sanchez Energy Corp
Common Stock |
37,214 | ||||||||
| 2017-06-09 | 3/A | SN |
Sanchez Energy Corp
Common Stock |
35,340 | ||||||||
| 2017-06-09 | 3/A | SN |
Sanchez Energy Corp
Common Stock |
71,276 | ||||||||
| 2017-06-09 | 3/A | SN |
Sanchez Energy Corp
Common Stock |
41,855 | ||||||||
| 2017-06-09 | 3/A | SN |
Sanchez Energy Corp
Common Stock |
6,291 | ||||||||
| 2017-06-09 | 3/A | SN |
Sanchez Energy Corp
Common Stock |
621,279 | ||||||||
| 2017-04-21 |
|
4 | HCC |
WARRIOR MET COAL, INC.
Common Stock |
S - Sale | -354,746 | 604,550 | -36.98 | 17.81 | -6,318,913 | 10,768,547 | |
| 2017-04-21 |
|
4 | HCC |
WARRIOR MET COAL, INC.
Common Stock |
S - Sale | -551,322 | 939,550 | -36.98 | 17.81 | -9,820,423 | 16,735,734 | |
| 2017-04-21 |
|
4 | HCC |
WARRIOR MET COAL, INC.
Common Stock |
S - Sale | -311,101 | 530,171 | -36.98 | 17.81 | -5,541,487 | 9,443,671 | |
| 2017-04-21 |
|
4 | HCC |
WARRIOR MET COAL, INC.
Common Stock |
S - Sale | -31,773 | 54,147 | -36.98 | 17.81 | -565,957 | 964,493 | |
| 2017-04-21 |
|
4 | HCC |
WARRIOR MET COAL, INC.
Common Stock |
S - Sale | -90,523 | 154,269 | -36.98 | 17.81 | -1,612,441 | 2,747,917 | |
| 2017-04-21 |
|
4 | HCC |
WARRIOR MET COAL, INC.
Common Stock |
S - Sale | -235,641 | 401,575 | -36.98 | 17.81 | -4,197,355 | 7,153,055 | |
| 2017-04-21 |
|
4 | HCC |
WARRIOR MET COAL, INC.
Common Stock |
S - Sale | -207,328 | 353,325 | -36.98 | 17.81 | -3,693,030 | 6,293,602 | |
| 2017-04-21 |
|
4 | HCC |
WARRIOR MET COAL, INC.
Common Stock |
S - Sale | -112,189 | 191,190 | -36.98 | 17.81 | -1,998,367 | 3,405,572 | |
| 2017-04-21 |
|
4 | HCC |
WARRIOR MET COAL, INC.
Common Stock |
S - Sale | -99,141 | 168,954 | -36.98 | 17.81 | -1,765,949 | 3,009,493 | |
| 2017-04-21 |
|
4 | HCC |
WARRIOR MET COAL, INC.
Common Stock |
S - Sale | -860,366 | 1,466,214 | -36.98 | 17.81 | -15,325,269 | 26,116,937 | |
| 2017-04-21 |
|
4 | HCC |
WARRIOR MET COAL, INC.
Common Stock |
S - Sale | -975,181 | 1,661,877 | -36.98 | 17.81 | -17,370,412 | 29,602,184 | |
| 2017-04-14 |
|
4 | CJES |
C&J Energy Services, Inc.
Common Stock |
S - Sale | -1,000,000 | 6,520,635 | -13.30 | 30.88 | -30,875,000 | 201,324,606 | |
| 2017-04-13 | 3 | HCC |
WARRIOR MET COAL, INC.
Common Stock |
12,992,191 | ||||||||
| 2017-04-13 | 3 | HCC |
WARRIOR MET COAL, INC.
Common Stock |
12,681,713 | ||||||||
| 2017-04-13 | 3 | HCC |
WARRIOR MET COAL, INC.
Common Stock |
10,623,228 | ||||||||
| 2017-04-13 | 3 | HCC |
WARRIOR MET COAL, INC.
Common Stock |
10,658,512 | ||||||||
| 2017-04-13 | 3 | HCC |
WARRIOR MET COAL, INC.
Common Stock |
10,915,786 | ||||||||
| 2017-04-13 | 3 | HCC |
WARRIOR MET COAL, INC.
Common Stock |
10,992,349 | ||||||||
| 2017-04-13 | 3 | HCC |
WARRIOR MET COAL, INC.
Common Stock |
10,599,925 | ||||||||
| 2017-04-13 | 3 | HCC |
WARRIOR MET COAL, INC.
Common Stock |
10,441,053 | ||||||||
| 2017-04-13 | 3 | HCC |
WARRIOR MET COAL, INC.
Common Stock |
11,196,405 | ||||||||
| 2017-04-13 | 3 | HCC |
WARRIOR MET COAL, INC.
Common Stock |
11,846,005 | ||||||||
| 2017-04-13 | 3 | HCC |
WARRIOR MET COAL, INC.
Common Stock |
11,314,429 | ||||||||
| 2017-04-13 | 3 | HCC |
WARRIOR MET COAL, INC.
Common Stock |
12,992,191 | ||||||||
| 2017-04-13 | 3 | HCC |
WARRIOR MET COAL, INC.
Common Stock |
12,681,713 | ||||||||
| 2017-04-13 | 3 | HCC |
WARRIOR MET COAL, INC.
Common Stock |
10,623,228 | ||||||||
| 2017-04-13 | 3 | HCC |
WARRIOR MET COAL, INC.
Common Stock |
10,658,512 | ||||||||
| 2017-04-13 | 3 | HCC |
WARRIOR MET COAL, INC.
Common Stock |
10,915,786 | ||||||||
| 2017-04-13 | 3 | HCC |
WARRIOR MET COAL, INC.
Common Stock |
10,992,349 | ||||||||
| 2017-04-13 | 3 | HCC |
WARRIOR MET COAL, INC.
Common Stock |
10,599,925 | ||||||||
| 2017-04-13 | 3 | HCC |
WARRIOR MET COAL, INC.
Common Stock |
10,441,053 | ||||||||
| 2017-04-13 | 3 | HCC |
WARRIOR MET COAL, INC.
Common Stock |
11,196,405 | ||||||||
| 2017-04-13 | 3 | HCC |
WARRIOR MET COAL, INC.
Common Stock |
11,846,005 | ||||||||
| 2017-04-13 | 3 | HCC |
WARRIOR MET COAL, INC.
Common Stock |
11,314,429 | ||||||||
| 2017-03-13 | 3 | SN |
Sanchez Energy Corp
Common Stock |
1,810,660 | ||||||||
| 2017-03-13 | 3 | SN |
Sanchez Energy Corp
Common Stock |
1,826,461 | ||||||||
| 2017-03-13 | 3 | SN |
Sanchez Energy Corp
Common Stock |
1,527,139 | ||||||||
| 2017-03-13 | 3 | SN |
Sanchez Energy Corp
Common Stock |
1,482,529 | ||||||||
| 2017-03-13 | 3 | SN |
Sanchez Energy Corp
Common Stock |
1,483,751 | ||||||||
| 2017-03-13 | 3 | SN |
Sanchez Energy Corp
Common Stock |
1,482,296 | ||||||||
| 2017-03-13 | 3 | SN |
Sanchez Energy Corp
Common Stock |
1,510,057 | ||||||||
| 2017-03-13 | 3 | SN |
Sanchez Energy Corp
Common Stock |
1,487,330 | ||||||||
| 2017-03-13 | 3 | SN |
Sanchez Energy Corp
Common Stock |
1,459,860 | ||||||||
| 2017-03-13 | 3 | SN |
Sanchez Energy Corp
Common Stock |
1,934,917 | ||||||||
| 2017-03-13 | 3 | SN |
Sanchez Energy Corp
Common Stock |
1,810,660 | ||||||||
| 2017-03-13 | 3 | SN |
Sanchez Energy Corp
Common Stock |
1,826,461 | ||||||||
| 2017-03-13 | 3 | SN |
Sanchez Energy Corp
Common Stock |
1,527,139 | ||||||||
| 2017-03-13 | 3 | SN |
Sanchez Energy Corp
Common Stock |
1,482,529 | ||||||||
| 2017-03-13 | 3 | SN |
Sanchez Energy Corp
Common Stock |
1,483,751 | ||||||||
| 2017-03-13 | 3 | SN |
Sanchez Energy Corp
Common Stock |
1,482,296 | ||||||||
| 2017-03-13 | 3 | SN |
Sanchez Energy Corp
Common Stock |
1,510,057 | ||||||||
| 2017-03-13 | 3 | SN |
Sanchez Energy Corp
Common Stock |
1,487,330 | ||||||||
| 2017-03-13 | 3 | SN |
Sanchez Energy Corp
Common Stock |
1,459,860 | ||||||||
| 2017-03-13 | 3 | SN |
Sanchez Energy Corp
Common Stock |
1,934,917 | ||||||||
| 2017-03-03 | 3 | CJES |
C&J Energy Services, Inc.
Common Stock |
15,041,270 | ||||||||
| 2017-03-03 | 3 | CJES |
C&J Energy Services, Inc.
Common Stock |
15,041,270 | ||||||||
| 2017-03-03 | 3 | CJES |
C&J Energy Services, Inc.
Common Stock |
15,041,270 | ||||||||
| 2017-03-03 | 3 | CJES |
C&J Energy Services, Inc.
Common Stock |
15,041,270 | ||||||||
| 2017-03-03 | 3 | CJES |
C&J Energy Services, Inc.
Common Stock |
15,041,270 | ||||||||
| 2017-03-03 | 3 | CJES |
C&J Energy Services, Inc.
Common Stock |
15,041,270 | ||||||||
| 2017-03-03 | 3 | CJES |
C&J Energy Services, Inc.
Common Stock |
15,041,270 | ||||||||
| 2017-02-01 | 3 | INVH |
Invitation Homes Inc.
Common Stock |
300,327,390 | ||||||||
| 2017-02-01 | 3 | INVH |
Invitation Homes Inc.
Common Stock |
263,742,480 | ||||||||
| 2017-02-01 | 3 | INVH |
Invitation Homes Inc.
Common Stock |
228,565,095 | ||||||||
| 2017-02-01 | 3 | INVH |
Invitation Homes Inc.
Common Stock |
253,854,057 | ||||||||
| 2017-02-01 | 3 | INVH |
Invitation Homes Inc.
Common Stock |
239,883,458 | ||||||||
| 2017-02-01 | 3 | INVH |
Invitation Homes Inc.
Common Stock |
235,196,220 | ||||||||
| 2017-02-01 | 3 | INVH |
Invitation Homes Inc.
Common Stock |
237,994,092 | ||||||||
| 2017-02-01 | 3 | INVH |
Invitation Homes Inc.
Common Stock |
300,327,390 | ||||||||
| 2017-02-01 | 3 | INVH |
Invitation Homes Inc.
Common Stock |
263,742,480 | ||||||||
| 2017-02-01 | 3 | INVH |
Invitation Homes Inc.
Common Stock |
228,565,095 | ||||||||
| 2017-02-01 | 3 | INVH |
Invitation Homes Inc.
Common Stock |
253,854,057 | ||||||||
| 2017-02-01 | 3 | INVH |
Invitation Homes Inc.
Common Stock |
239,883,458 | ||||||||
| 2017-02-01 | 3 | INVH |
Invitation Homes Inc.
Common Stock |
235,196,220 | ||||||||
| 2017-02-01 | 3 | INVH |
Invitation Homes Inc.
Common Stock |
237,994,092 | ||||||||
| 2017-01-12 |
|
4 | HPP |
Hudson Pacific Properties, Inc.
Common Units |
S - Sale | -343,939 | 0 | -100.00 | 35.00 | -12,037,865 | ||
| 2017-01-12 |
|
4 | HPP |
Hudson Pacific Properties, Inc.
Common Units |
S - Sale | -4,299 | 0 | -100.00 | 35.00 | -150,465 | ||
| 2017-01-12 |
|
4 | HPP |
Hudson Pacific Properties, Inc.
Common Units |
S - Sale | -80,415 | 0 | -100.00 | 35.00 | -2,814,525 | ||
| 2017-01-12 |
|
4 | HPP |
Hudson Pacific Properties, Inc.
Common Units |
S - Sale | -23,507 | 0 | -100.00 | 35.00 | -822,745 | ||
| 2017-01-12 |
|
4 | HPP |
Hudson Pacific Properties, Inc.
Common Units |
S - Sale | -4,107 | 0 | -100.00 | 35.00 | -143,745 | ||
| 2017-01-12 |
|
4 | HPP |
Hudson Pacific Properties, Inc.
Common Units |
S - Sale | -659,693 | 0 | -100.00 | 35.00 | -23,089,255 | ||
| 2017-01-12 |
|
4 | HPP |
Hudson Pacific Properties, Inc.
Common Units |
S - Sale | -812,707 | 0 | -100.00 | 35.00 | -28,444,745 | ||
| 2017-01-12 |
|
4 | HPP |
Hudson Pacific Properties, Inc.
Common Units |
S - Sale | -387,643 | 0 | -100.00 | 35.00 | -13,567,505 | ||
| 2017-01-12 |
|
4 | HPP |
Hudson Pacific Properties, Inc.
Common Units |
S - Sale | -1,331,054 | 0 | -100.00 | 35.00 | -46,586,890 | ||
| 2017-01-12 |
|
4 | HPP |
Hudson Pacific Properties, Inc.
Common Units |
S - Sale | -192,137 | 0 | -100.00 | 35.00 | -6,724,795 | ||
| 2017-01-12 |
|
4 | HPP |
Hudson Pacific Properties, Inc.
Common Units |
S - Sale | -468,959 | 0 | -100.00 | 35.00 | -16,413,565 | ||
| 2017-01-12 |
|
4 | HPP |
Hudson Pacific Properties, Inc.
Common Units |
S - Sale | -1,715,068 | 0 | -100.00 | 35.00 | -60,027,380 | ||
| 2017-01-12 |
|
4 | HPP |
Hudson Pacific Properties, Inc.
Common Units |
S - Sale | -667,556 | 0 | -100.00 | 35.00 | -23,364,460 | ||
| 2017-01-12 |
|
4 | HPP |
Hudson Pacific Properties, Inc.
Common Units |
S - Sale | -1,907,396 | 0 | -100.00 | 35.00 | -66,758,860 | ||
| 2017-01-12 |
|
4 | HPP |
Hudson Pacific Properties, Inc.
Common Stock |
S - Sale | -345,053 | 0 | -100.00 | 35.00 | -12,076,855 | ||
| 2017-01-12 |
|
4 | HPP |
Hudson Pacific Properties, Inc.
Common Stock |
S - Sale | -4,313 | 0 | -100.00 | 35.00 | -150,955 | ||
| 2017-01-12 |
|
4 | HPP |
Hudson Pacific Properties, Inc.
Common Stock |
S - Sale | -80,675 | 0 | -100.00 | 35.00 | -2,823,625 | ||
| 2017-01-12 |
|
4 | HPP |
Hudson Pacific Properties, Inc.
Common Stock |
S - Sale | -23,584 | 0 | -100.00 | 35.00 | -825,440 | ||
| 2017-01-12 |
|
4 | HPP |
Hudson Pacific Properties, Inc.
Common Stock |
S - Sale | -4,120 | 0 | -100.00 | 35.00 | -144,200 | ||
| 2017-01-12 |
|
4 | HPP |
Hudson Pacific Properties, Inc.
Common Stock |
S - Sale | -661,829 | 0 | -100.00 | 35.00 | -23,164,015 | ||
| 2017-01-12 |
|
4 | HPP |
Hudson Pacific Properties, Inc.
Common Stock |
S - Sale | -815,338 | 0 | -100.00 | 35.00 | -28,536,830 | ||
| 2017-01-12 |
|
4 | HPP |
Hudson Pacific Properties, Inc.
Common Stock |
S - Sale | -388,898 | 0 | -100.00 | 35.00 | -13,611,430 | ||
| 2017-01-12 |
|
4 | HPP |
Hudson Pacific Properties, Inc.
Common Stock |
S - Sale | -1,335,362 | 0 | -100.00 | 35.00 | -46,737,670 | ||
| 2017-01-12 |
|
4 | HPP |
Hudson Pacific Properties, Inc.
Common Stock |
S - Sale | -192,760 | 0 | -100.00 | 35.00 | -6,746,600 | ||
| 2017-01-12 |
|
4 | HPP |
Hudson Pacific Properties, Inc.
Common Stock |
S - Sale | -470,476 | 0 | -100.00 | 35.00 | -16,466,660 | ||
| 2017-01-12 |
|
4 | HPP |
Hudson Pacific Properties, Inc.
Common Stock |
S - Sale | -1,720,620 | 0 | -100.00 | 35.00 | -60,221,700 | ||
| 2017-01-12 |
|
4 | HPP |
Hudson Pacific Properties, Inc.
Common Stock |
S - Sale | -669,716 | 0 | -100.00 | 35.00 | -23,440,060 | ||
| 2017-01-12 |
|
4 | HPP |
Hudson Pacific Properties, Inc.
Common Stock |
S - Sale | -1,913,567 | 0 | -100.00 | 35.00 | -66,974,845 | ||
| 2016-11-30 |
|
4 | HPP |
Hudson Pacific Properties, Inc.
Common Units |
S - Sale | -148,092 | 80,415 | -64.81 | 32.50 | -4,812,990 | 2,613,488 | |
| 2016-11-30 |
|
4 | HPP |
Hudson Pacific Properties, Inc.
Common Units |
S - Sale | -43,292 | 23,507 | -64.81 | 32.50 | -1,406,990 | 763,978 | |
| 2016-11-30 |
|
4 | HPP |
Hudson Pacific Properties, Inc.
Common Units |
S - Sale | -7,564 | 4,107 | -64.81 | 32.50 | -245,830 | 133,478 | |
| 2016-11-30 |
|
4 | HPP |
Hudson Pacific Properties, Inc.
Common Units |
S - Sale | -1,214,894 | 659,693 | -64.81 | 32.50 | -39,484,055 | 21,440,022 | |
| 2016-11-30 |
|
4 | HPP |
Hudson Pacific Properties, Inc.
Common Units |
S - Sale | -1,496,685 | 812,707 | -64.81 | 32.50 | -48,642,262 | 26,412,978 | |
| 2016-11-30 |
|
4 | HPP |
Hudson Pacific Properties, Inc.
Common Units |
S - Sale | -713,884 | 387,643 | -64.81 | 32.50 | -23,201,230 | 12,598,398 | |
| 2016-11-30 |
|
4 | HPP |
Hudson Pacific Properties, Inc.
Common Units |
S - Sale | -2,451,274 | 1,331,054 | -64.81 | 32.50 | -79,666,405 | 43,259,255 | |
| 2016-11-30 |
|
4 | HPP |
Hudson Pacific Properties, Inc.
Common Units |
S - Sale | -354,823 | 192,137 | -64.87 | 32.50 | -11,531,748 | 6,244,452 | |
| 2016-11-30 |
|
4 | HPP |
Hudson Pacific Properties, Inc.
Common Units |
S - Sale | -865,168 | 468,959 | -64.85 | 32.50 | -28,117,960 | 15,241,168 | |
| 2016-11-30 |
|
4 | HPP |
Hudson Pacific Properties, Inc.
Common Units |
S - Sale | -3,164,080 | 1,715,068 | -64.85 | 32.50 | -102,832,600 | 55,739,710 | |
| 2016-11-30 |
|
4 | HPP |
Hudson Pacific Properties, Inc.
Common Units |
S - Sale | -1,231,555 | 667,556 | -64.85 | 32.50 | -40,025,538 | 21,695,570 | |
| 2016-11-30 |
|
4 | HPP |
Hudson Pacific Properties, Inc.
Common Units |
S - Sale | -3,518,893 | 1,907,396 | -64.85 | 32.50 | -114,364,022 | 61,990,370 | |
| 2016-11-30 |
|
4 | HPP |
Hudson Pacific Properties, Inc.
Common Units |
S - Sale | -690,000 | 343,939 | -66.74 | 32.50 | -22,425,000 | 11,178,018 | |
| 2016-11-30 |
|
4 | HPP |
Hudson Pacific Properties, Inc.
Common Units |
S - Sale | -8,624 | 4,299 | -66.73 | 32.50 | -280,280 | 139,718 | |
| 2016-11-30 |
|
4 | HPP |
Hudson Pacific Properties, Inc.
Common Units |
S - Sale | -13,234 | 0 | -100.00 | 32.50 | -430,105 | ||
| 2016-11-30 |
|
4 | HPP |
Hudson Pacific Properties, Inc.
Common Units |
S - Sale | -3,868 | 0 | -100.00 | 32.50 | -125,710 | ||
| 2016-11-30 |
|
4 | HPP |
Hudson Pacific Properties, Inc.
Common Units |
S - Sale | -676 | 0 | -100.00 | 32.50 | -21,970 | ||
| 2016-11-30 |
|
4 | HPP |
Hudson Pacific Properties, Inc.
Common Units |
S - Sale | -108,563 | 0 | -100.00 | 32.50 | -3,528,298 | ||
| 2016-11-30 |
|
4 | HPP |
Hudson Pacific Properties, Inc.
Common Units |
S - Sale | -133,743 | 0 | -100.00 | 32.50 | -4,346,648 | ||
| 2016-11-30 |
|
4 | HPP |
Hudson Pacific Properties, Inc.
Common Units |
S - Sale | -63,793 | 0 | -100.00 | 32.50 | -2,073,272 | ||
| 2016-11-30 |
|
4 | HPP |
Hudson Pacific Properties, Inc.
Common Units |
S - Sale | -219,045 | 0 | -100.00 | 32.50 | -7,118,962 | ||
| 2016-11-30 |
|
4 | HPP |
Hudson Pacific Properties, Inc.
Common Units |
S - Sale | -30,638 | 0 | -100.00 | 32.50 | -995,735 | ||
| 2016-11-30 |
|
4 | HPP |
Hudson Pacific Properties, Inc.
Common Units |
S - Sale | -75,642 | 0 | -100.00 | 32.50 | -2,458,365 | ||
| 2016-11-30 |
|
4 | HPP |
Hudson Pacific Properties, Inc.
Common Units |
S - Sale | -276,637 | 0 | -100.00 | 32.50 | -8,990,702 | ||
| 2016-11-30 |
|
4 | HPP |
Hudson Pacific Properties, Inc.
Common Units |
S - Sale | -107,674 | 0 | -100.00 | 32.50 | -3,499,405 | ||
| 2016-11-30 |
|
4 | HPP |
Hudson Pacific Properties, Inc.
Common Units |
S - Sale | -307,659 | 0 | -100.00 | 32.50 | -9,998,918 | ||
| 2016-11-18 |
|
4 | SUM |
Summit Materials, Inc.
LP Units of Summit Materials Holdings L.P. |
C - Conversion | -12,501 | 0 | -100.00 | ||||
| 2016-11-18 |
|
4 | SUM |
Summit Materials, Inc.
LP Units of Summit Materials Holdings L.P. |
C - Conversion | -21,513 | 0 | -100.00 | ||||
| 2016-11-18 |
|
4 | SUM |
Summit Materials, Inc.
LP Units of Summit Materials Holdings L.P. |
C - Conversion | -253,891 | 0 | -100.00 | ||||
| 2016-11-18 |
|
4 | SUM |
Summit Materials, Inc.
LP Units of Summit Materials Holdings L.P. |
C - Conversion | -2,814,207 | 0 | -100.00 | ||||
| 2016-11-18 |
|
4 | SUM |
Summit Materials, Inc.
LP Units of Summit Materials Holdings L.P. |
C - Conversion | -13,349,610 | 0 | -100.00 | ||||
| 2016-11-18 |
|
4 | SUM |
Summit Materials, Inc.
Class A Common Stock |
S - Sale | -12,501 | 0 | -100.00 | 21.87 | -273,397 | ||
| 2016-11-18 |
|
4 | SUM |
Summit Materials, Inc.
Class A Common Stock |
C - Conversion | 12,501 | 12,501 | |||||
| 2016-11-18 |
|
4 | SUM |
Summit Materials, Inc.
Class A Common Stock |
S - Sale | -21,513 | 0 | -100.00 | 21.87 | -470,489 | ||
| 2016-11-18 |
|
4 | SUM |
Summit Materials, Inc.
Class A Common Stock |
C - Conversion | 21,513 | 21,513 | |||||
| 2016-11-18 |
|
4 | SUM |
Summit Materials, Inc.
Class A Common Stock |
S - Sale | -253,891 | 0 | -100.00 | 21.87 | -5,552,596 | ||
| 2016-11-18 |
|
4 | SUM |
Summit Materials, Inc.
Class A Common Stock |
C - Conversion | 253,891 | 253,891 | |||||
| 2016-11-18 |
|
4 | SUM |
Summit Materials, Inc.
Class A Common Stock |
S - Sale | -2,814,207 | 0 | -100.00 | 21.87 | -61,546,707 | ||
| 2016-11-18 |
|
4 | SUM |
Summit Materials, Inc.
Class A Common Stock |
C - Conversion | 2,814,207 | 2,814,207 | |||||
| 2016-11-18 |
|
4 | SUM |
Summit Materials, Inc.
Class A Common Stock |
S - Sale | -13,349,610 | 0 | -100.00 | 21.87 | -291,955,971 | ||
| 2016-11-18 |
|
4 | SUM |
Summit Materials, Inc.
Class A Common Stock |
C - Conversion | 13,349,610 | 13,349,610 | |||||
| 2016-09-12 | 3 | NONE |
Titan Energy, LLC
Common Shares |
1,003,457 | ||||||||
| 2016-09-12 | 3 | NONE |
Titan Energy, LLC
Common Shares |
1,090,684 | ||||||||
| 2016-09-12 | 3 | NONE |
Titan Energy, LLC
Common Shares |
1,442,636 | ||||||||
| 2016-09-12 | 3 | NONE |
Titan Energy, LLC
Common Shares |
1,061,139 | ||||||||
| 2016-09-12 | 3 | NONE |
Titan Energy, LLC
Common Shares |
1,108,139 | ||||||||
| 2016-09-12 | 3 | NONE |
Titan Energy, LLC
Common Shares |
1,040,179 | ||||||||
| 2016-09-12 | 3 | NONE |
Titan Energy, LLC
Common Shares |
1,046,878 | ||||||||
| 2016-09-12 | 3 | NONE |
Titan Energy, LLC
Common Shares |
1,003,457 | ||||||||
| 2016-09-12 | 3 | NONE |
Titan Energy, LLC
Common Shares |
1,090,684 | ||||||||
| 2016-09-12 | 3 | NONE |
Titan Energy, LLC
Common Shares |
1,442,636 | ||||||||
| 2016-09-12 | 3 | NONE |
Titan Energy, LLC
Common Shares |
1,061,139 | ||||||||
| 2016-09-12 | 3 | NONE |
Titan Energy, LLC
Common Shares |
1,108,139 | ||||||||
| 2016-09-12 | 3 | NONE |
Titan Energy, LLC
Common Shares |
1,040,179 | ||||||||
| 2016-09-12 | 3 | NONE |
Titan Energy, LLC
Common Shares |
1,046,878 | ||||||||
| 2016-07-21 |
|
4 | SUM |
Summit Materials, Inc.
LP Units of Summit Materials Holdings L.P. |
C - Conversion | -9,278 | 12,501 | -42.60 | ||||
| 2016-07-21 |
|
4 | SUM |
Summit Materials, Inc.
LP Units of Summit Materials Holdings L.P. |
C - Conversion | -15,966 | 21,513 | -42.60 | ||||
| 2016-07-21 |
|
4 | SUM |
Summit Materials, Inc.
LP Units of Summit Materials Holdings L.P. |
C - Conversion | -188,427 | 253,891 | -42.60 | ||||
| 2016-07-21 |
|
4 | SUM |
Summit Materials, Inc.
LP Units of Summit Materials Holdings L.P. |
C - Conversion | -2,088,574 | 2,814,207 | -42.60 | ||||
| 2016-07-21 |
|
4 | SUM |
Summit Materials, Inc.
LP Units of Summit Materials Holdings L.P. |
C - Conversion | -9,907,459 | 13,349,610 | -42.60 | ||||
| 2016-07-21 |
|
4 | SUM |
Summit Materials, Inc.
Class A Common Stock |
S - Sale | -9,278 | 0 | -100.00 | 20.67 | -191,776 | ||
| 2016-07-21 |
|
4 | SUM |
Summit Materials, Inc.
Class A Common Stock |
C - Conversion | 9,278 | 9,278 | |||||
| 2016-07-21 |
|
4 | SUM |
Summit Materials, Inc.
Class A Common Stock |
S - Sale | -15,966 | 0 | -100.00 | 20.67 | -330,017 | ||
| 2016-07-21 |
|
4 | SUM |
Summit Materials, Inc.
Class A Common Stock |
C - Conversion | 15,966 | 15,966 | |||||
| 2016-07-21 |
|
4 | SUM |
Summit Materials, Inc.
Class A Common Stock |
S - Sale | -188,427 | 0 | -100.00 | 20.67 | -3,894,786 | ||
| 2016-07-21 |
|
4 | SUM |
Summit Materials, Inc.
Class A Common Stock |
C - Conversion | 188,427 | 188,427 | |||||
| 2016-07-21 |
|
4 | SUM |
Summit Materials, Inc.
Class A Common Stock |
S - Sale | -2,088,574 | 0 | -100.00 | 20.67 | -43,170,825 | ||
| 2016-07-21 |
|
4 | SUM |
Summit Materials, Inc.
Class A Common Stock |
C - Conversion | 2,088,574 | 2,088,574 | |||||
| 2016-07-21 |
|
4 | SUM |
Summit Materials, Inc.
Class A Common Stock |
S - Sale | -9,907,459 | 0 | -100.00 | 20.67 | -204,787,178 | ||
| 2016-07-21 |
|
4 | SUM |
Summit Materials, Inc.
Class A Common Stock |
C - Conversion | 9,907,459 | 9,907,459 | |||||
| 2016-07-21 |
|
4 | HPP |
Hudson Pacific Properties, Inc.
Common Units |
S - Sale | -760,000 | 1,033,939 | -42.36 | 30.32 | -23,043,200 | 31,349,030 | |
| 2016-07-21 |
|
4 | HPP |
Hudson Pacific Properties, Inc.
Common Units |
S - Sale | -9,500 | 12,923 | -42.37 | 30.32 | -288,040 | 391,825 | |
| 2016-07-21 |
|
4 | HPP |
Hudson Pacific Properties, Inc.
Common Units |
S - Sale | -177,693 | 13,234 | -93.07 | 30.32 | -5,387,652 | 401,255 | |
| 2016-07-21 |
|
4 | HPP |
Hudson Pacific Properties, Inc.
Common Units |
S - Sale | -51,945 | 3,868 | -93.07 | 30.32 | -1,574,972 | 117,278 | |
| 2016-07-21 |
|
4 | HPP |
Hudson Pacific Properties, Inc.
Common Units |
S - Sale | -9,075 | 676 | -93.07 | 30.32 | -275,154 | 20,496 | |
| 2016-07-21 |
|
4 | HPP |
Hudson Pacific Properties, Inc.
Common Units |
S - Sale | -1,457,720 | 108,563 | -93.07 | 30.32 | -44,198,070 | 3,291,630 | |
| 2016-07-21 |
|
4 | HPP |
Hudson Pacific Properties, Inc.
Common Units |
S - Sale | -1,795,834 | 133,743 | -93.07 | 30.32 | -54,449,687 | 4,055,088 | |
| 2016-07-21 |
|
4 | HPP |
Hudson Pacific Properties, Inc.
Common Units |
S - Sale | -856,572 | 63,793 | -93.07 | 30.32 | -25,971,263 | 1,934,204 | |
| 2016-07-21 |
|
4 | HPP |
Hudson Pacific Properties, Inc.
Common Units |
S - Sale | -2,941,221 | 219,045 | -93.07 | 30.32 | -89,177,821 | 6,641,444 | |
| 2016-07-21 |
|
4 | HPP |
Hudson Pacific Properties, Inc.
Common Units |
S - Sale | -424,566 | 30,638 | -93.27 | 30.32 | -12,872,841 | 928,944 | |
| 2016-07-21 |
|
4 | HPP |
Hudson Pacific Properties, Inc.
Common Units |
S - Sale | -1,036,254 | 75,642 | -93.20 | 30.32 | -31,419,221 | 2,293,465 | |
| 2016-07-21 |
|
4 | HPP |
Hudson Pacific Properties, Inc.
Common Units |
S - Sale | -3,789,775 | 276,637 | -93.20 | 30.32 | -114,905,978 | 8,387,634 | |
| 2016-07-21 |
|
4 | HPP |
Hudson Pacific Properties, Inc.
Common Units |
S - Sale | -1,475,093 | 107,674 | -93.20 | 30.32 | -44,724,820 | 3,264,676 | |
| 2016-07-21 |
|
4 | HPP |
Hudson Pacific Properties, Inc.
Common Units |
S - Sale | -4,214,752 | 307,659 | -93.20 | 30.32 | -127,791,281 | 9,328,221 | |
| 2016-05-16 |
|
4 | HPP |
Hudson Pacific Properties, Inc.
Common Units |
S - Sale | -400,000 | 1,793,939 | -18.23 | 29.08 | -11,632,000 | 52,167,746 | |
| 2016-05-16 |
|
4 | HPP |
Hudson Pacific Properties, Inc.
Common Units |
S - Sale | -5,000 | 22,423 | -18.23 | 29.08 | -145,400 | 652,061 | |
| 2016-05-16 |
|
4 | HPP |
Hudson Pacific Properties, Inc.
Common Units |
S - Sale | -93,522 | 190,927 | -32.88 | 29.08 | -2,719,620 | 5,552,157 | |
| 2016-05-16 |
|
4 | HPP |
Hudson Pacific Properties, Inc.
Common Units |
S - Sale | -27,339 | 55,813 | -32.88 | 29.08 | -795,018 | 1,623,042 | |
| 2016-05-16 |
|
4 | HPP |
Hudson Pacific Properties, Inc.
Common Units |
S - Sale | -4,777 | 9,751 | -32.88 | 29.08 | -138,915 | 283,559 | |
| 2016-05-16 |
|
4 | HPP |
Hudson Pacific Properties, Inc.
Common Units |
S - Sale | -767,221 | 1,566,283 | -32.88 | 29.08 | -22,310,787 | 45,547,510 | |
| 2016-05-16 |
|
4 | HPP |
Hudson Pacific Properties, Inc.
Common Units |
S - Sale | -945,176 | 1,929,577 | -32.88 | 29.08 | -27,485,718 | 56,112,099 | |
| 2016-05-16 |
|
4 | HPP |
Hudson Pacific Properties, Inc.
Common Units |
S - Sale | -450,827 | 920,365 | -32.88 | 29.08 | -13,110,049 | 26,764,214 | |
| 2016-05-16 |
|
4 | HPP |
Hudson Pacific Properties, Inc.
Common Units |
S - Sale | -1,548,011 | 3,160,266 | -32.88 | 29.08 | -45,016,160 | 91,900,535 | |
| 2016-05-16 |
|
4 | HPP |
Hudson Pacific Properties, Inc.
Common Units |
S - Sale | -223,455 | 455,204 | -32.93 | 29.08 | -6,498,071 | 13,237,332 | |
| 2016-05-16 |
|
4 | HPP |
Hudson Pacific Properties, Inc.
Common Units |
S - Sale | -545,397 | 1,111,896 | -32.91 | 29.08 | -15,860,145 | 32,333,936 | |
| 2016-05-16 |
|
4 | HPP |
Hudson Pacific Properties, Inc.
Common Units |
S - Sale | -1,994,618 | 4,066,412 | -32.91 | 29.08 | -58,003,491 | 118,251,261 | |
| 2016-05-16 |
|
4 | HPP |
Hudson Pacific Properties, Inc.
Common Units |
S - Sale | -776,365 | 1,582,767 | -32.91 | 29.08 | -22,576,694 | 46,026,864 | |
| 2016-05-16 |
|
4 | HPP |
Hudson Pacific Properties, Inc.
Common Units |
S - Sale | -2,218,292 | 4,522,411 | -32.91 | 29.08 | -64,507,931 | 131,511,712 | |
| 2016-04-21 |
|
4 | SUM |
Summit Materials, Inc.
LP Units of Summit Materials Holdings L.P. |
C - Conversion | -7,047 | 21,779 | -24.45 | ||||
| 2016-04-21 |
|
4 | SUM |
Summit Materials, Inc.
LP Units of Summit Materials Holdings L.P. |
C - Conversion | -12,126 | 37,479 | -24.45 | ||||
| 2016-04-21 |
|
4 | SUM |
Summit Materials, Inc.
LP Units of Summit Materials Holdings L.P. |
C - Conversion | -143,097 | 442,318 | -24.44 | ||||
| 2016-04-21 |
|
4 | SUM |
Summit Materials, Inc.
LP Units of Summit Materials Holdings L.P. |
C - Conversion | -1,586,120 | 4,902,781 | -24.44 | ||||
| 2016-04-21 |
|
4 | SUM |
Summit Materials, Inc.
LP Units of Summit Materials Holdings L.P. |
C - Conversion | -7,523,988 | 23,257,069 | -24.44 | ||||
| 2016-04-21 |
|
4 | SUM |
Summit Materials, Inc.
Class A Common Stock |
S - Sale | -7,047 | 0 | -100.00 | 20.00 | -140,940 | ||
| 2016-04-21 |
|
4 | SUM |
Summit Materials, Inc.
Class A Common Stock |
C - Conversion | 7,047 | 7,047 | |||||
| 2016-04-21 |
|
4 | SUM |
Summit Materials, Inc.
Class A Common Stock |
S - Sale | -12,126 | 0 | -100.00 | 20.00 | -242,520 | ||
| 2016-04-21 |
|
4 | SUM |
Summit Materials, Inc.
Class A Common Stock |
C - Conversion | 12,126 | 12,126 | |||||
| 2016-04-21 |
|
4 | SUM |
Summit Materials, Inc.
Class A Common Stock |
S - Sale | -143,097 | 0 | -100.00 | 20.00 | -2,861,940 | ||
| 2016-04-21 |
|
4 | SUM |
Summit Materials, Inc.
Class A Common Stock |
C - Conversion | 143,097 | 143,097 | |||||
| 2016-04-21 |
|
4 | SUM |
Summit Materials, Inc.
Class A Common Stock |
S - Sale | -1,586,120 | 0 | -100.00 | 20.00 | -31,722,400 | ||
| 2016-04-21 |
|
4 | SUM |
Summit Materials, Inc.
Class A Common Stock |
C - Conversion | 1,586,120 | 1,586,120 | |||||
| 2016-04-21 |
|
4 | SUM |
Summit Materials, Inc.
Class A Common Stock |
S - Sale | -7,523,988 | 0 | -100.00 | 20.00 | -150,479,760 | ||
| 2016-04-21 |
|
4 | SUM |
Summit Materials, Inc.
Class A Common Stock |
C - Conversion | 7,523,988 | 7,523,988 | |||||
| 2016-04-11 | 3 | UAN |
CVR PARTNERS, LP
Common Units representing Limited Partner Interests |
18,609,706 | ||||||||
| 2016-04-11 | 3 | UAN |
CVR PARTNERS, LP
Common Units representing Limited Partner Interests |
17,625,348 | ||||||||
| 2016-04-11 | 3 | UAN |
CVR PARTNERS, LP
Common Units representing Limited Partner Interests |
17,625,808 | ||||||||
| 2016-04-11 | 3 | UAN |
CVR PARTNERS, LP
Common Units representing Limited Partner Interests |
19,115,513 | ||||||||
| 2016-04-11 | 3 | UAN |
CVR PARTNERS, LP
Common Units representing Limited Partner Interests |
18,133,335 | ||||||||
| 2016-04-11 | 3 | UAN |
CVR PARTNERS, LP
Common Units representing Limited Partner Interests |
19,625,237 | ||||||||
| 2016-04-11 | 3 | UAN |
CVR PARTNERS, LP
Common Units representing Limited Partner Interests |
21,851,669 | ||||||||
| 2016-04-11 | 3 | UAN |
CVR PARTNERS, LP
Common Units representing Limited Partner Interests |
20,413,384 | ||||||||
| 2016-04-11 | 3 | UAN |
CVR PARTNERS, LP
Common Units representing Limited Partner Interests |
18,609,706 | ||||||||
| 2016-04-11 | 3 | UAN |
CVR PARTNERS, LP
Common Units representing Limited Partner Interests |
17,625,348 | ||||||||
| 2016-04-11 | 3 | UAN |
CVR PARTNERS, LP
Common Units representing Limited Partner Interests |
17,625,808 | ||||||||
| 2016-04-11 | 3 | UAN |
CVR PARTNERS, LP
Common Units representing Limited Partner Interests |
19,115,513 | ||||||||
| 2016-04-11 | 3 | UAN |
CVR PARTNERS, LP
Common Units representing Limited Partner Interests |
18,133,335 | ||||||||
| 2016-04-11 | 3 | UAN |
CVR PARTNERS, LP
Common Units representing Limited Partner Interests |
19,625,237 | ||||||||
| 2016-04-11 | 3 | UAN |
CVR PARTNERS, LP
Common Units representing Limited Partner Interests |
21,851,669 | ||||||||
| 2016-04-11 | 3 | UAN |
CVR PARTNERS, LP
Common Units representing Limited Partner Interests |
20,413,384 | ||||||||
| 2016-04-05 |
|
4 | RTK |
RENTECH, INC.
Call Right (Obligation to Buy) |
E - Other | -806,306 | 0 | -100.00 | ||||
| 2016-04-05 |
|
4 | RTK |
RENTECH, INC.
Call Right (Obligation to Sell) |
E - Other | 17,900 | 0 | -100.00 | ||||
| 2016-04-05 |
|
4 | RTK |
RENTECH, INC.
Call Right (Obligation to Buy) |
E - Other | -1,295,106 | 0 | -100.00 | ||||
| 2016-04-05 |
|
4 | RTK |
RENTECH, INC.
Call Right (Obligation to Sell) |
E - Other | 28,751 | 0 | -100.00 | ||||
| 2016-04-05 |
|
4 | RTK |
RENTECH, INC.
Call Right (Obligation to Buy) |
E - Other | -726,204 | 0 | -100.00 | ||||
| 2016-04-05 |
|
4 | RTK |
RENTECH, INC.
Call Right (Obligation to Sell) |
E - Other | 16,122 | 0 | -100.00 | ||||
| 2016-04-05 |
|
4 | RTK |
RENTECH, INC.
Call Right (Obligation to Buy) |
E - Other | -300,300 | 0 | -100.00 | ||||
| 2016-04-05 |
|
4 | RTK |
RENTECH, INC.
Call Right (Obligation to Sell) |
E - Other | 6,667 | 0 | -100.00 | ||||
| 2016-04-05 |
|
4 | RTK |
RENTECH, INC.
Call Right (Obligation to Buy) |
E - Other | -585,202 | 0 | -100.00 | ||||
| 2016-04-05 |
|
4 | RTK |
RENTECH, INC.
Call Right (Obligation to Sell) |
E - Other | 12,991 | 0 | -100.00 | ||||
| 2016-04-05 |
|
4 | RTK |
RENTECH, INC.
Call Right (Obligation to Buy) |
E - Other | -173,113 | 0 | -100.00 | ||||
| 2016-04-05 |
|
4 | RTK |
RENTECH, INC.
Call Right (Obligation to Sell) |
E - Other | 3,843 | 0 | -100.00 | ||||
| 2016-04-05 |
|
4 | RTK |
RENTECH, INC.
Call Right (Obligation to Buy) |
E - Other | -172,986 | 0 | -100.00 | ||||
| 2016-04-05 |
|
4 | RTK |
RENTECH, INC.
Call Right (Obligation to Sell) |
E - Other | 3,840 | 0 | -100.00 | ||||
| 2016-04-05 |
|
4 | RTK |
RENTECH, INC.
Call Right (Obligation to Buy) |
E - Other | -445,283 | 0 | -100.00 | ||||
| 2016-04-05 |
|
4 | RTK |
RENTECH, INC.
Call Right (Obligation to Sell) |
E - Other | 9,885 | 0 | -100.00 | ||||
| 2016-04-05 |
|
4 | RTK |
RENTECH, INC.
Series E Convertible Preferred Stock |
J - Other | -17,900 | 0 | -100.00 | ||||
| 2016-04-05 |
|
4 | RTK |
RENTECH, INC.
Series E Convertible Preferred Stock |
J - Other | -28,751 | 0 | -100.00 | ||||
| 2016-04-05 |
|
4 | RTK |
RENTECH, INC.
Series E Convertible Preferred Stock |
J - Other | -16,122 | 0 | -100.00 | ||||
| 2016-04-05 |
|
4 | RTK |
RENTECH, INC.
Series E Convertible Preferred Stock |
J - Other | -6,667 | 0 | -100.00 | ||||
| 2016-04-05 |
|
4 | RTK |
RENTECH, INC.
Series E Convertible Preferred Stock |
J - Other | -12,991 | 0 | -100.00 | ||||
| 2016-04-05 |
|
4 | RTK |
RENTECH, INC.
Series E Convertible Preferred Stock |
J - Other | -3,843 | 0 | -100.00 | ||||
| 2016-04-05 |
|
4 | RTK |
RENTECH, INC.
Series E Convertible Preferred Stock |
J - Other | -3,840 | 0 | -100.00 | ||||
| 2016-04-05 |
|
4 | RTK |
RENTECH, INC.
Series E Convertible Preferred Stock |
J - Other | -9,885 | 0 | -100.00 | ||||
| 2015-10-08 |
|
4 | PFGC |
Performance Food Group Co
Common Stock |
S - Sale | -15,570 | 0 | -100.00 | 17.96 | -279,559 | ||
| 2015-10-08 |
|
4 | PFGC |
Performance Food Group Co
Common Stock |
S - Sale | -646,997 | 0 | -100.00 | 17.96 | -11,616,831 | ||
| 2015-10-08 |
|
4 | PFGC |
Performance Food Group Co
Common Stock |
S - Sale | -21,511 | 787,909 | -2.66 | 17.96 | -386,230 | 14,146,906 | |
| 2015-10-08 |
|
4 | PFGC |
Performance Food Group Co
Common Stock |
S - Sale | -3,517 | 128,829 | -2.66 | 17.96 | -63,148 | 2,313,125 | |
| 2015-10-08 |
|
4 | PFGC |
Performance Food Group Co
Common Stock |
S - Sale | -17,472 | 639,995 | -2.66 | 17.96 | -313,710 | 11,491,110 | |
| 2015-10-08 |
|
4 | PFGC |
Performance Food Group Co
Common Stock |
S - Sale | -220,454 | 8,074,985 | -2.66 | 17.96 | -3,958,252 | 144,986,356 | |
| 2015-10-08 |
|
4 | PFGC |
Performance Food Group Co
Common Stock |
S - Sale | -1,376,220 | 50,409,332 | -2.66 | 17.96 | -24,710,030 | 905,099,556 | |
| 2015-10-01 | 3 | PFGC |
Performance Food Group Co
Common Stock |
114,128,344 | ||||||||
| 2015-10-01 | 3 | PFGC |
Performance Food Group Co
Common Stock |
70,638,231 | ||||||||
| 2015-10-01 | 3 | PFGC |
Performance Food Group Co
Common Stock |
63,000,259 | ||||||||
| 2015-10-01 | 3 | PFGC |
Performance Food Group Co
Common Stock |
62,475,138 | ||||||||
| 2015-10-01 | 3 | PFGC |
Performance Food Group Co
Common Stock |
63,152,212 | ||||||||
| 2015-10-01 | 3 | PFGC |
Performance Food Group Co
Common Stock |
62,989,790 | ||||||||
| 2015-10-01 | 3 | PFGC |
Performance Food Group Co
Common Stock |
62,358,362 | ||||||||
| 2015-10-01 | 3 | PFGC |
Performance Food Group Co
Common Stock |
114,128,344 | ||||||||
| 2015-10-01 | 3 | PFGC |
Performance Food Group Co
Common Stock |
70,638,231 | ||||||||
| 2015-10-01 | 3 | PFGC |
Performance Food Group Co
Common Stock |
63,000,259 | ||||||||
| 2015-10-01 | 3 | PFGC |
Performance Food Group Co
Common Stock |
62,475,138 | ||||||||
| 2015-10-01 | 3 | PFGC |
Performance Food Group Co
Common Stock |
63,152,212 | ||||||||
| 2015-10-01 | 3 | PFGC |
Performance Food Group Co
Common Stock |
62,989,790 | ||||||||
| 2015-10-01 | 3 | PFGC |
Performance Food Group Co
Common Stock |
62,358,362 | ||||||||
| 2015-08-13 |
|
4 | SUM |
Summit Materials, Inc.
LP Units of Summit Materials Holdings L.P. |
S - Sale | -12,867 | 28,826 | -30.86 | ||||
| 2015-08-13 |
|
4 | SUM |
Summit Materials, Inc.
LP Units of Summit Materials Holdings L.P. |
S - Sale | -22,143 | 49,605 | -30.86 | ||||
| 2015-08-13 |
|
4 | SUM |
Summit Materials, Inc.
LP Units of Summit Materials Holdings L.P. |
S - Sale | -261,315 | 585,415 | -30.86 | ||||
| 2015-08-13 |
|
4 | SUM |
Summit Materials, Inc.
LP Units of Summit Materials Holdings L.P. |
S - Sale | -2,896,494 | 6,488,901 | -30.86 | ||||
| 2015-08-13 |
|
4 | SUM |
Summit Materials, Inc.
LP Units of Summit Materials Holdings L.P. |
S - Sale | -13,739,945 | 30,781,057 | -30.86 | ||||
| 2015-04-13 | 3 | HPP |
Hudson Pacific Properties, Inc.
Common Stock |
10,539,878 | ||||||||
| 2015-04-13 | 3 | HPP |
Hudson Pacific Properties, Inc.
Common Stock |
9,296,027 | ||||||||
| 2015-04-13 | 3 | HPP |
Hudson Pacific Properties, Inc.
Common Stock |
10,346,931 | ||||||||
| 2015-04-13 | 3 | HPP |
Hudson Pacific Properties, Inc.
Common Stock |
9,096,787 | ||||||||
| 2015-04-13 | 3 | HPP |
Hudson Pacific Properties, Inc.
Common Stock |
8,819,071 | ||||||||
| 2015-04-13 | 3 | HPP |
Hudson Pacific Properties, Inc.
Common Stock |
9,961,673 | ||||||||
| 2015-04-13 | 3 | HPP |
Hudson Pacific Properties, Inc.
Common Stock |
9,015,209 | ||||||||
| 2015-04-13 | 3 | HPP |
Hudson Pacific Properties, Inc.
Common Stock |
9,441,649 | ||||||||
| 2015-04-13 | 3 | HPP |
Hudson Pacific Properties, Inc.
Common Stock |
9,288,140 | ||||||||
| 2015-04-13 | 3 | HPP |
Hudson Pacific Properties, Inc.
Common Stock |
8,630,431 | ||||||||
| 2015-04-13 | 3 | HPP |
Hudson Pacific Properties, Inc.
Common Stock |
8,649,895 | ||||||||
| 2015-04-13 | 3 | HPP |
Hudson Pacific Properties, Inc.
Common Stock |
8,706,986 | ||||||||
| 2015-04-13 | 3 | HPP |
Hudson Pacific Properties, Inc.
Common Stock |
8,630,624 | ||||||||
| 2015-04-13 | 3 | HPP |
Hudson Pacific Properties, Inc.
Common Stock |
8,971,364 | ||||||||
| 2015-04-13 | 3 | HPP |
Hudson Pacific Properties, Inc.
Common Stock |
10,539,878 | ||||||||
| 2015-04-13 | 3 | HPP |
Hudson Pacific Properties, Inc.
Common Stock |
9,296,027 | ||||||||
| 2015-04-13 | 3 | HPP |
Hudson Pacific Properties, Inc.
Common Stock |
10,346,931 | ||||||||
| 2015-04-13 | 3 | HPP |
Hudson Pacific Properties, Inc.
Common Stock |
9,096,787 | ||||||||
| 2015-04-13 | 3 | HPP |
Hudson Pacific Properties, Inc.
Common Stock |
8,819,071 | ||||||||
| 2015-04-13 | 3 | HPP |
Hudson Pacific Properties, Inc.
Common Stock |
9,961,673 | ||||||||
| 2015-04-13 | 3 | HPP |
Hudson Pacific Properties, Inc.
Common Stock |
9,015,209 | ||||||||
| 2015-04-13 | 3 | HPP |
Hudson Pacific Properties, Inc.
Common Stock |
9,441,649 | ||||||||
| 2015-04-13 | 3 | HPP |
Hudson Pacific Properties, Inc.
Common Stock |
9,288,140 | ||||||||
| 2015-04-13 | 3 | HPP |
Hudson Pacific Properties, Inc.
Common Stock |
8,630,431 | ||||||||
| 2015-04-13 | 3 | HPP |
Hudson Pacific Properties, Inc.
Common Stock |
8,649,895 | ||||||||
| 2015-04-13 | 3 | HPP |
Hudson Pacific Properties, Inc.
Common Stock |
8,706,986 | ||||||||
| 2015-04-13 | 3 | HPP |
Hudson Pacific Properties, Inc.
Common Stock |
8,630,624 | ||||||||
| 2015-04-13 | 3 | HPP |
Hudson Pacific Properties, Inc.
Common Stock |
8,971,364 | ||||||||
| 2015-04-07 |
|
4 | LQ |
La Quinta Holdings Inc.
Common Stock |
S - Sale | -78,633 | 888,596 | -8.13 | ||||
| 2015-04-07 |
|
4 | LQ |
La Quinta Holdings Inc.
Common Stock |
S - Sale | -15,626 | 176,582 | -8.13 | ||||
| 2015-04-07 |
|
4 | LQ |
La Quinta Holdings Inc.
Common Stock |
S - Sale | -498,730 | 5,635,931 | -8.13 | ||||
| 2015-04-07 |
|
4 | LQ |
La Quinta Holdings Inc.
Common Stock |
S - Sale | -194,120 | 2,193,670 | -8.13 | ||||
| 2015-04-07 |
|
4 | LQ |
La Quinta Holdings Inc.
Common Stock |
S - Sale | -136,369 | 1,541,053 | -8.13 | ||||
| 2015-04-07 |
|
4 | LQ |
La Quinta Holdings Inc.
Common Stock |
S - Sale | -539,029 | 6,091,344 | -8.13 | ||||
| 2015-04-07 |
|
4 | LQ |
La Quinta Holdings Inc.
Common Stock |
S - Sale | -15,780 | 178,324 | -8.13 | ||||
| 2015-04-07 |
|
4 | LQ |
La Quinta Holdings Inc.
Common Stock |
S - Sale | -53,816 | 608,156 | -8.13 | ||||
| 2015-04-07 |
|
4 | LQ |
La Quinta Holdings Inc.
Common Stock |
S - Sale | -46,373 | 524,036 | -8.13 | ||||
| 2015-04-07 |
|
4 | LQ |
La Quinta Holdings Inc.
Common Stock |
S - Sale | -33,759 | 381,502 | -8.13 | ||||
| 2015-04-07 |
|
4 | LQ |
La Quinta Holdings Inc.
Common Stock |
S - Sale | -12,678 | 143,262 | -8.13 | ||||
| 2015-04-07 |
|
4 | LQ |
La Quinta Holdings Inc.
Common Stock |
S - Sale | -31,335 | 354,094 | -8.13 | ||||
| 2015-04-07 |
|
4 | LQ |
La Quinta Holdings Inc.
Common Stock |
S - Sale | -93,169 | 1,052,872 | -8.13 | ||||
| 2015-04-07 |
|
4 | LQ |
La Quinta Holdings Inc.
Common Stock |
S - Sale | -164,977 | 1,864,344 | -8.13 | ||||
| 2015-04-07 |
|
4 | LQ |
La Quinta Holdings Inc.
Common Stock |
S - Sale | -1,198,106 | 13,539,310 | -8.13 | ||||
| 2015-04-01 |
|
4 | LQ |
La Quinta Holdings Inc.
Common Stock |
S - Sale | -524,219 | 967,229 | -35.15 | ||||
| 2015-04-01 |
|
4 | LQ |
La Quinta Holdings Inc.
Common Stock |
S - Sale | -104,173 | 192,208 | -35.15 | ||||
| 2015-04-01 |
|
4 | LQ |
La Quinta Holdings Inc.
Common Stock |
S - Sale | -3,324,860 | 6,134,661 | -35.15 | ||||
| 2015-04-01 |
|
4 | LQ |
La Quinta Holdings Inc.
Common Stock |
S - Sale | -1,294,134 | 2,387,790 | -35.15 | ||||
| 2015-04-01 |
|
4 | LQ |
La Quinta Holdings Inc.
Common Stock |
S - Sale | -909,128 | 1,677,422 | -35.15 | ||||
| 2015-04-01 |
|
4 | LQ |
La Quinta Holdings Inc.
Common Stock |
S - Sale | -3,593,527 | 6,630,373 | -35.15 | ||||
| 2015-04-01 |
|
4 | LQ |
La Quinta Holdings Inc.
Common Stock |
S - Sale | -105,200 | 194,104 | -35.15 | ||||
| 2015-04-01 |
|
4 | LQ |
La Quinta Holdings Inc.
Common Stock |
S - Sale | -358,776 | 661,972 | -35.15 | ||||
| 2015-04-01 |
|
4 | LQ |
La Quinta Holdings Inc.
Common Stock |
S - Sale | -309,150 | 570,409 | -35.15 | ||||
| 2015-04-01 |
|
4 | LQ |
La Quinta Holdings Inc.
Common Stock |
S - Sale | -225,063 | 415,261 | -35.15 | ||||
| 2015-04-01 |
|
4 | LQ |
La Quinta Holdings Inc.
Common Stock |
S - Sale | -84,516 | 155,940 | -35.15 | ||||
| 2015-04-01 |
|
4 | LQ |
La Quinta Holdings Inc.
Common Stock |
S - Sale | -208,894 | 385,429 | -35.15 | ||||
| 2015-04-01 |
|
4 | LQ |
La Quinta Holdings Inc.
Common Stock |
S - Sale | -621,131 | 1,146,041 | -35.15 | ||||
| 2015-04-01 |
|
4 | LQ |
La Quinta Holdings Inc.
Common Stock |
S - Sale | -1,099,851 | 2,029,321 | -35.15 | ||||
| 2015-04-01 |
|
4 | LQ |
La Quinta Holdings Inc.
Common Stock |
S - Sale | -7,987,378 | 14,737,416 | -35.15 | ||||
| 2015-03-12 | 3 | SUM |
Summit Materials, Inc.
Class B Common Stock |
138,014,594 | ||||||||
| 2015-03-12 | 3 | SUM |
Summit Materials, Inc.
Class B Common Stock |
138,014,594 | ||||||||
| 2015-03-12 | 3 | SUM |
Summit Materials, Inc.
Class B Common Stock |
138,014,594 | ||||||||
| 2015-03-12 | 3 | SUM |
Summit Materials, Inc.
Class B Common Stock |
138,014,594 | ||||||||
| 2015-03-12 | 3 | SUM |
Summit Materials, Inc.
Class B Common Stock |
138,014,594 | ||||||||
| 2015-03-12 | 3 | SUM |
Summit Materials, Inc.
Class B Common Stock |
138,014,594 | ||||||||
| 2014-11-26 |
|
4 | LQ |
La Quinta Holdings Inc.
Common Stock |
S - Sale | -581,062 | 1,491,448 | -28.04 | 19.40 | -11,272,603 | 28,934,091 | |
| 2014-11-26 |
|
4 | LQ |
La Quinta Holdings Inc.
Common Stock |
S - Sale | -115,469 | 296,381 | -28.04 | 19.40 | -2,240,099 | 5,749,791 | |
| 2014-11-26 |
|
4 | LQ |
La Quinta Holdings Inc.
Common Stock |
S - Sale | -3,685,388 | 9,459,521 | -28.04 | 19.40 | -71,496,527 | 183,514,707 | |
| 2014-11-26 |
|
4 | LQ |
La Quinta Holdings Inc.
Common Stock |
S - Sale | -1,434,461 | 3,681,924 | -28.04 | 19.40 | -27,828,543 | 71,429,326 | |
| 2014-11-26 |
|
4 | LQ |
La Quinta Holdings Inc.
Common Stock |
S - Sale | -1,007,709 | 2,586,550 | -28.04 | 19.40 | -19,549,555 | 50,179,070 | |
| 2014-11-26 |
|
4 | LQ |
La Quinta Holdings Inc.
Common Stock |
S - Sale | -3,983,186 | 10,223,900 | -28.04 | 19.40 | -77,273,808 | 198,343,660 | |
| 2014-11-26 |
|
4 | LQ |
La Quinta Holdings Inc.
Common Stock |
S - Sale | -116,607 | 299,304 | -28.04 | 19.40 | -2,262,176 | 5,806,498 | |
| 2014-11-26 |
|
4 | LQ |
La Quinta Holdings Inc.
Common Stock |
S - Sale | -397,679 | 1,020,748 | -28.04 | 19.40 | -7,714,973 | 19,802,511 | |
| 2014-11-26 |
|
4 | LQ |
La Quinta Holdings Inc.
Common Stock |
S - Sale | -342,673 | 879,559 | -28.04 | 19.40 | -6,647,856 | 17,063,445 | |
| 2014-11-26 |
|
4 | LQ |
La Quinta Holdings Inc.
Common Stock |
S - Sale | -249,468 | 640,324 | -28.04 | 19.40 | -4,839,679 | 12,422,286 | |
| 2014-11-26 |
|
4 | LQ |
La Quinta Holdings Inc.
Common Stock |
S - Sale | -93,680 | 240,456 | -28.04 | 19.40 | -1,817,392 | 4,664,846 | |
| 2014-11-26 |
|
4 | LQ |
La Quinta Holdings Inc.
Common Stock |
S - Sale | -231,546 | 594,323 | -28.04 | 19.40 | -4,491,992 | 11,529,866 | |
| 2014-11-26 |
|
4 | LQ |
La Quinta Holdings Inc.
Common Stock |
S - Sale | -688,482 | 1,767,172 | -28.04 | 19.40 | -13,356,551 | 34,283,137 | |
| 2014-11-26 |
|
4 | LQ |
La Quinta Holdings Inc.
Common Stock |
S - Sale | -1,219,112 | 3,129,172 | -28.04 | 19.40 | -23,650,773 | 60,705,937 | |
| 2014-11-26 |
|
4 | LQ |
La Quinta Holdings Inc.
Common Stock |
S - Sale | -8,853,478 | 22,724,794 | -28.04 | 19.40 | -171,757,473 | 440,861,004 | |
| 2014-06-18 |
|
4 | PBF |
PBF Energy Inc.
Series A Units of PBF Energy |
C - Conversion | -31,865 | 6,735 | -82.55 | ||||
| 2014-06-18 |
|
4 | PBF |
PBF Energy Inc.
Series A Units of PBF Energy |
C - Conversion | -263,373 | 55,669 | -82.55 | ||||
| 2014-06-18 |
|
4 | PBF |
PBF Energy Inc.
Series A Units of PBF Energy |
C - Conversion | -69,353 | 14,659 | -82.55 | ||||
| 2014-06-18 |
|
4 | PBF |
PBF Energy Inc.
Series A Units of PBF Energy |
C - Conversion | -2,253,028 | 476,222 | -82.55 | ||||
| 2014-06-18 |
|
4 | PBF |
PBF Energy Inc.
Series A Units of PBF Energy |
C - Conversion | -12,573,720 | 2,657,702 | -82.55 | ||||
| 2014-06-18 |
|
4 | PBF |
PBF Energy Inc.
Class A Common Stock |
S - Sale | -31,865 | 0 | -100.00 | 29.75 | -947,995 | ||
| 2014-06-18 |
|
4 | PBF |
PBF Energy Inc.
Class A Common Stock |
C - Conversion | 31,865 | 31,865 | |||||
| 2014-06-18 |
|
4 | PBF |
PBF Energy Inc.
Class A Common Stock |
S - Sale | -263,373 | 0 | -100.00 | 29.75 | -7,835,335 | ||
| 2014-06-18 |
|
4 | PBF |
PBF Energy Inc.
Class A Common Stock |
C - Conversion | 263,373 | 263,373 | |||||
| 2014-06-18 |
|
4 | PBF |
PBF Energy Inc.
Class A Common Stock |
S - Sale | -69,353 | 0 | -100.00 | 29.75 | -2,063,250 | ||
| 2014-06-18 |
|
4 | PBF |
PBF Energy Inc.
Class A Common Stock |
C - Conversion | 69,353 | 69,353 | |||||
| 2014-06-18 |
|
4 | PBF |
PBF Energy Inc.
Class A Common Stock |
S - Sale | -2,253,028 | 0 | -100.00 | 29.75 | -67,027,581 | ||
| 2014-06-18 |
|
4 | PBF |
PBF Energy Inc.
Class A Common Stock |
C - Conversion | 2,253,028 | 2,253,028 | |||||
| 2014-06-18 |
|
4 | PBF |
PBF Energy Inc.
Class A Common Stock |
S - Sale | -12,573,720 | 0 | -100.00 | 29.75 | -374,068,174 | ||
| 2014-06-18 |
|
4 | PBF |
PBF Energy Inc.
Class A Common Stock |
C - Conversion | 12,573,720 | 12,573,720 | |||||
| 2014-04-09 | 3 | LQ |
La Quinta Holdings Inc.
Common Stock |
113,613,848 | ||||||||
| 2014-04-09 | 3 | LQ |
La Quinta Holdings Inc.
Common Stock |
86,383,860 | ||||||||
| 2014-04-09 | 3 | LQ |
La Quinta Holdings Inc.
Common Stock |
84,491,230 | ||||||||
| 2014-04-09 | 3 | LQ |
La Quinta Holdings Inc.
Common Stock |
82,861,445 | ||||||||
| 2014-04-09 | 3 | LQ |
La Quinta Holdings Inc.
Common Stock |
82,369,712 | ||||||||
| 2014-04-09 | 3 | LQ |
La Quinta Holdings Inc.
Common Stock |
82,925,368 | ||||||||
| 2014-04-09 | 3 | LQ |
La Quinta Holdings Inc.
Common Stock |
83,257,808 | ||||||||
| 2014-04-09 | 3 | LQ |
La Quinta Holdings Inc.
Common Stock |
83,454,003 | ||||||||
| 2014-04-09 | 3 | LQ |
La Quinta Holdings Inc.
Common Stock |
82,451,487 | ||||||||
| 2014-04-09 | 3 | LQ |
La Quinta Holdings Inc.
Common Stock |
96,242,662 | ||||||||
| 2014-04-09 | 3 | LQ |
La Quinta Holdings Inc.
Common Stock |
85,629,835 | ||||||||
| 2014-04-09 | 3 | LQ |
La Quinta Holdings Inc.
Common Stock |
87,151,961 | ||||||||
| 2014-04-09 | 3 | LQ |
La Quinta Holdings Inc.
Common Stock |
95,180,485 | ||||||||
| 2014-04-09 | 3 | LQ |
La Quinta Holdings Inc.
Common Stock |
82,447,426 | ||||||||
| 2014-04-09 | 3 | LQ |
La Quinta Holdings Inc.
Common Stock |
84,108,086 | ||||||||
| 2014-04-09 | 3 | LQ |
La Quinta Holdings Inc.
Common Stock |
113,613,848 | ||||||||
| 2014-04-09 | 3 | LQ |
La Quinta Holdings Inc.
Common Stock |
86,383,860 | ||||||||
| 2014-04-09 | 3 | LQ |
La Quinta Holdings Inc.
Common Stock |
84,491,230 | ||||||||
| 2014-04-09 | 3 | LQ |
La Quinta Holdings Inc.
Common Stock |
82,861,445 | ||||||||
| 2014-04-09 | 3 | LQ |
La Quinta Holdings Inc.
Common Stock |
82,369,712 | ||||||||
| 2014-04-09 | 3 | LQ |
La Quinta Holdings Inc.
Common Stock |
82,925,368 | ||||||||
| 2014-04-09 | 3 | LQ |
La Quinta Holdings Inc.
Common Stock |
83,257,808 | ||||||||
| 2014-04-09 | 3 | LQ |
La Quinta Holdings Inc.
Common Stock |
83,454,003 | ||||||||
| 2014-04-09 | 3 | LQ |
La Quinta Holdings Inc.
Common Stock |
82,451,487 | ||||||||
| 2014-04-09 | 3 | LQ |
La Quinta Holdings Inc.
Common Stock |
96,242,662 | ||||||||
| 2014-04-09 | 3 | LQ |
La Quinta Holdings Inc.
Common Stock |
85,629,835 | ||||||||
| 2014-04-09 | 3 | LQ |
La Quinta Holdings Inc.
Common Stock |
87,151,961 | ||||||||
| 2014-04-09 | 3 | LQ |
La Quinta Holdings Inc.
Common Stock |
95,180,485 | ||||||||
| 2014-04-09 | 3 | LQ |
La Quinta Holdings Inc.
Common Stock |
82,447,426 | ||||||||
| 2014-04-09 | 3 | LQ |
La Quinta Holdings Inc.
Common Stock |
84,108,086 | ||||||||
| 2014-01-14 |
|
4 | PBF |
PBF Energy Inc.
Series A Units of PBF Energy |
C - Conversion | -15,732 | 38,601 | -28.95 | ||||
| 2014-01-14 |
|
4 | PBF |
PBF Energy Inc.
Series A Units of PBF Energy |
C - Conversion | -130,028 | 319,042 | -28.95 | ||||
| 2014-01-14 |
|
4 | PBF |
PBF Energy Inc.
Series A Units of PBF Energy |
C - Conversion | -34,240 | 84,012 | -28.95 | ||||
| 2014-01-14 |
|
4 | PBF |
PBF Energy Inc.
Series A Units of PBF Energy |
C - Conversion | -1,112,325 | 2,729,250 | -28.95 | ||||
| 2014-01-14 |
|
4 | PBF |
PBF Energy Inc.
Series A Units of PBF Energy |
C - Conversion | -6,207,675 | 15,231,423 | -28.95 | ||||
| 2014-01-14 |
|
4 | PBF |
PBF Energy Inc.
Class A Common Stock |
S - Sale | -15,732 | 0 | -100.00 | 27.25 | -428,698 | ||
| 2014-01-14 |
|
4 | PBF |
PBF Energy Inc.
Class A Common Stock |
C - Conversion | 15,732 | 15,732 | |||||
| 2014-01-14 |
|
4 | PBF |
PBF Energy Inc.
Class A Common Stock |
S - Sale | -130,028 | 0 | -100.00 | 27.25 | -3,543,254 | ||
| 2014-01-14 |
|
4 | PBF |
PBF Energy Inc.
Class A Common Stock |
C - Conversion | 130,028 | 130,028 | |||||
| 2014-01-14 |
|
4 | PBF |
PBF Energy Inc.
Class A Common Stock |
S - Sale | -34,240 | 0 | -100.00 | 27.25 | -933,032 | ||
| 2014-01-14 |
|
4 | PBF |
PBF Energy Inc.
Class A Common Stock |
C - Conversion | 34,240 | 34,240 | |||||
| 2014-01-14 |
|
4 | PBF |
PBF Energy Inc.
Class A Common Stock |
S - Sale | -1,112,325 | 0 | -100.00 | 27.25 | -30,310,862 | ||
| 2014-01-14 |
|
4 | PBF |
PBF Energy Inc.
Class A Common Stock |
C - Conversion | 1,112,325 | 1,112,325 | |||||
| 2014-01-14 |
|
4 | PBF |
PBF Energy Inc.
Class A Common Stock |
S - Sale | -6,207,675 | 0 | -100.00 | 27.25 | -169,159,154 | ||
| 2014-01-14 |
|
4 | PBF |
PBF Energy Inc.
Class A Common Stock |
C - Conversion | 6,207,675 | 6,207,675 | |||||
| 2013-06-14 |
|
4 | PBF |
PBF Energy Inc.
Series A Units of PBF Energy |
C - Conversion | -16,728 | 54,333 | -23.54 | ||||
| 2013-06-14 |
|
4 | PBF |
PBF Energy Inc.
Series A Units of PBF Energy |
C - Conversion | -138,263 | 449,069 | -23.54 | ||||
| 2013-06-14 |
|
4 | PBF |
PBF Energy Inc.
Series A Units of PBF Energy |
C - Conversion | -36,408 | 118,252 | -23.54 | ||||
| 2013-06-14 |
|
4 | PBF |
PBF Energy Inc.
Series A Units of PBF Energy |
C - Conversion | -1,182,772 | 3,841,575 | -23.54 | ||||
| 2013-06-14 |
|
4 | PBF |
PBF Energy Inc.
Series A Units of PBF Energy |
C - Conversion | -6,600,828 | 21,439,098 | -23.54 | ||||
| 2013-06-14 |
|
4 | PBF |
PBF Energy Inc.
Class A Common Stock |
S - Sale | -16,728 | 0 | -100.00 | 26.19 | -438,116 | ||
| 2013-06-14 |
|
4 | PBF |
PBF Energy Inc.
Class A Common Stock |
C - Conversion | 16,728 | 16,728 | |||||
| 2013-06-14 |
|
4 | PBF |
PBF Energy Inc.
Class A Common Stock |
S - Sale | -138,263 | 0 | -100.00 | 26.19 | -3,621,102 | ||
| 2013-06-14 |
|
4 | PBF |
PBF Energy Inc.
Class A Common Stock |
C - Conversion | 138,263 | 138,263 | |||||
| 2013-06-14 |
|
4 | PBF |
PBF Energy Inc.
Class A Common Stock |
S - Sale | -36,408 | 0 | -100.00 | 26.19 | -953,532 | ||
| 2013-06-14 |
|
4 | PBF |
PBF Energy Inc.
Class A Common Stock |
C - Conversion | 36,408 | 36,408 | |||||
| 2013-06-14 |
|
4 | PBF |
PBF Energy Inc.
Class A Common Stock |
S - Sale | -1,182,772 | 0 | -100.00 | 26.19 | -30,976,811 | ||
| 2013-06-14 |
|
4 | PBF |
PBF Energy Inc.
Class A Common Stock |
C - Conversion | 1,182,772 | 1,182,772 | |||||
| 2013-06-14 |
|
4 | PBF |
PBF Energy Inc.
Class A Common Stock |
S - Sale | -6,600,828 | 0 | -100.00 | 26.19 | -172,875,689 | ||
| 2013-06-14 |
|
4 | PBF |
PBF Energy Inc.
Class A Common Stock |
C - Conversion | 6,600,828 | 6,600,828 | |||||
| 2012-12-20 |
|
4 | PBF |
PBF Energy Inc.
Series A Units of PBF Energy Company LLC |
S - Sale | -3,217 | 71,061 | -4.33 | 26.00 | -83,652 | 1,847,591 | |
| 2012-12-20 |
|
4 | PBF |
PBF Energy Inc.
Series A Units of PBF Energy Company LLC |
S - Sale | -26,592 | 587,332 | -4.33 | 26.00 | -691,400 | 15,270,632 | |
| 2012-12-20 |
|
4 | PBF |
PBF Energy Inc.
Series A Units of PBF Energy Company LLC |
S - Sale | -7,002 | 154,660 | -4.33 | 26.00 | -182,065 | 4,021,160 | |
| 2012-12-20 |
|
4 | PBF |
PBF Energy Inc.
Series A Units of PBF Energy Company LLC |
S - Sale | -227,484 | 5,024,347 | -4.33 | 26.00 | -5,914,592 | 130,633,030 | |
| 2012-12-20 |
|
4 | PBF |
PBF Energy Inc.
Series A Units of PBF Energy Company LLC |
S - Sale | -1,269,547 | 28,039,926 | -4.33 | 26.00 | -33,008,212 | 729,038,079 | |
| 2012-12-13 | 3 | PBF |
PBF Energy Inc.
Class B Common Stock |
1 | ||||||||
| 2012-12-13 | 3 | PBF |
PBF Energy Inc.
Class B Common Stock |
1 | ||||||||
| 2012-12-13 | 3 | PBF |
PBF Energy Inc.
Class B Common Stock |
1 | ||||||||
| 2012-12-13 | 3 | PBF |
PBF Energy Inc.
Class B Common Stock |
1 | ||||||||
| 2012-12-13 | 3 | PBF |
PBF Energy Inc.
Class B Common Stock |
1 |
P
공개 시장에서 또는 사적으로 비파생증권 또는 파생증권 매입
S
공개 시장에서 또는 사적으로 비파생증권 또는 파생증권 매각
A
자사로부터 유가증권(옵션 등)을 보조, 지급 또는 기타 취득
C
파생상품 전환
D
자사에게 유가증권을 매각 또는 양도
F
기업으로부터 인도 받은 유가증권의 일부를 사용한 행사 가격 또는 조세 채무의 지급
G
내부자에 의한 또는 내부자에게 증권 증여
K
지분스왑 및 유사 위험 회피거래
M
자사로부터 인도 받은 파생증권(옵션 등)의 행사 또는 전환
V
보고서 양식 4에 자진 신고된 거래
J
기타 (거래 내용을 설명하는 각주와 동반)